To view the full 2020 Donor Survey Click Here
A recap of our donor survey from Capitol Communicator can be found below.
In November 2020, Williams Whittle, in conjunction with research firm KB Insights, conducted a national survey of consumers matching the census profile of the United States by location and demographics (gender, age, income, ethnicity, marital status, and presence of children). The highlights of their donation history, future giving, and communication preferences are provided below.
Donation History
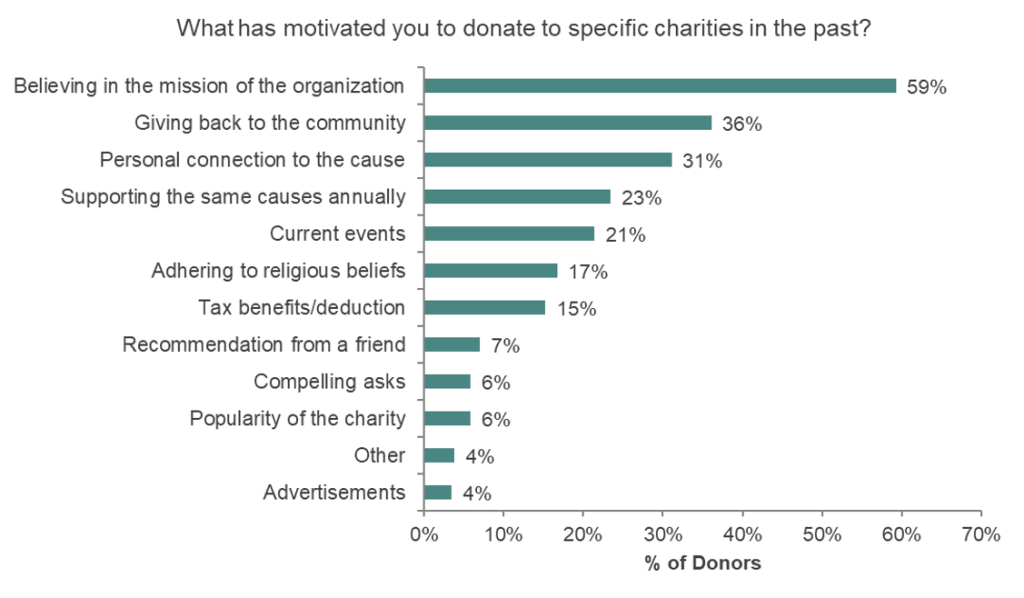
1. Mission is the #1 Motivator
The greatest national motivator for donations was a belief in the organization’s mission at 59%, followed by giving back to the community at 36%, and a personal connection to the cause at 31%.
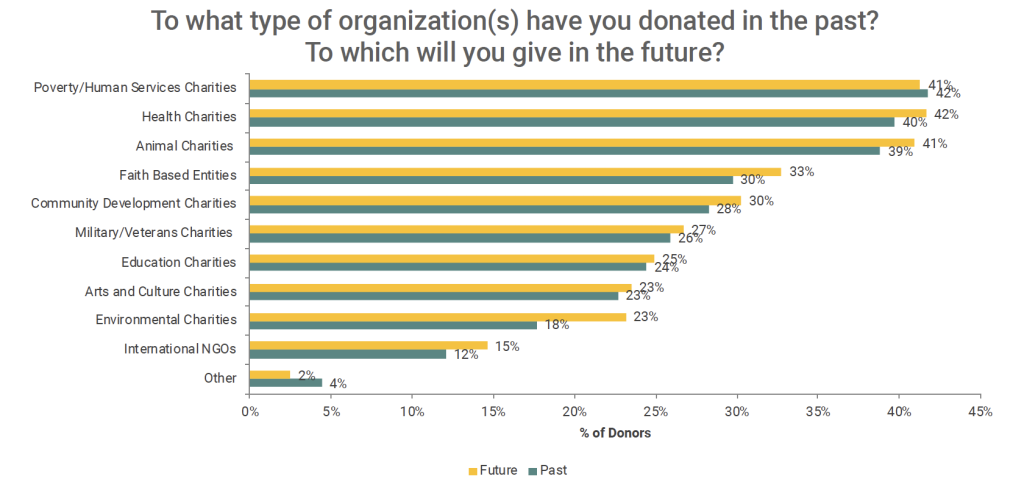
2. Poverty/Human Services and Health Charities are the Two Most Favored Categories
Poverty/Human Services and Health Charities topped the list as the top two types of organizations people have donated to in the past. Animal charities came in third followed by faith-based entities. The same is true for future giving types.
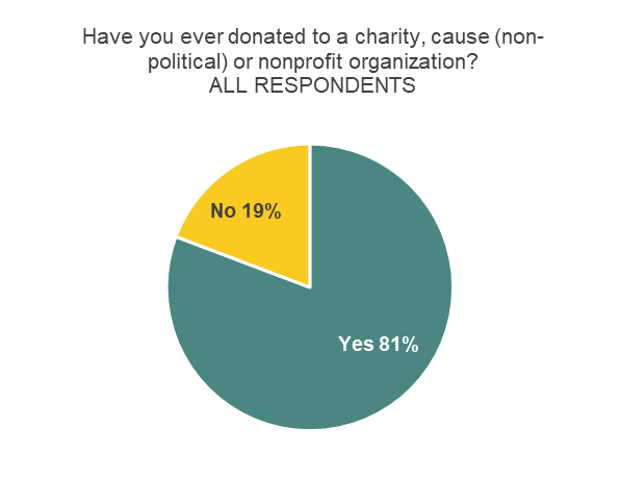
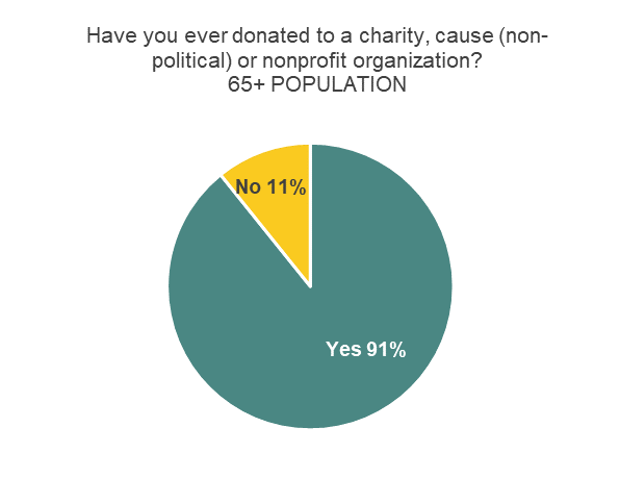
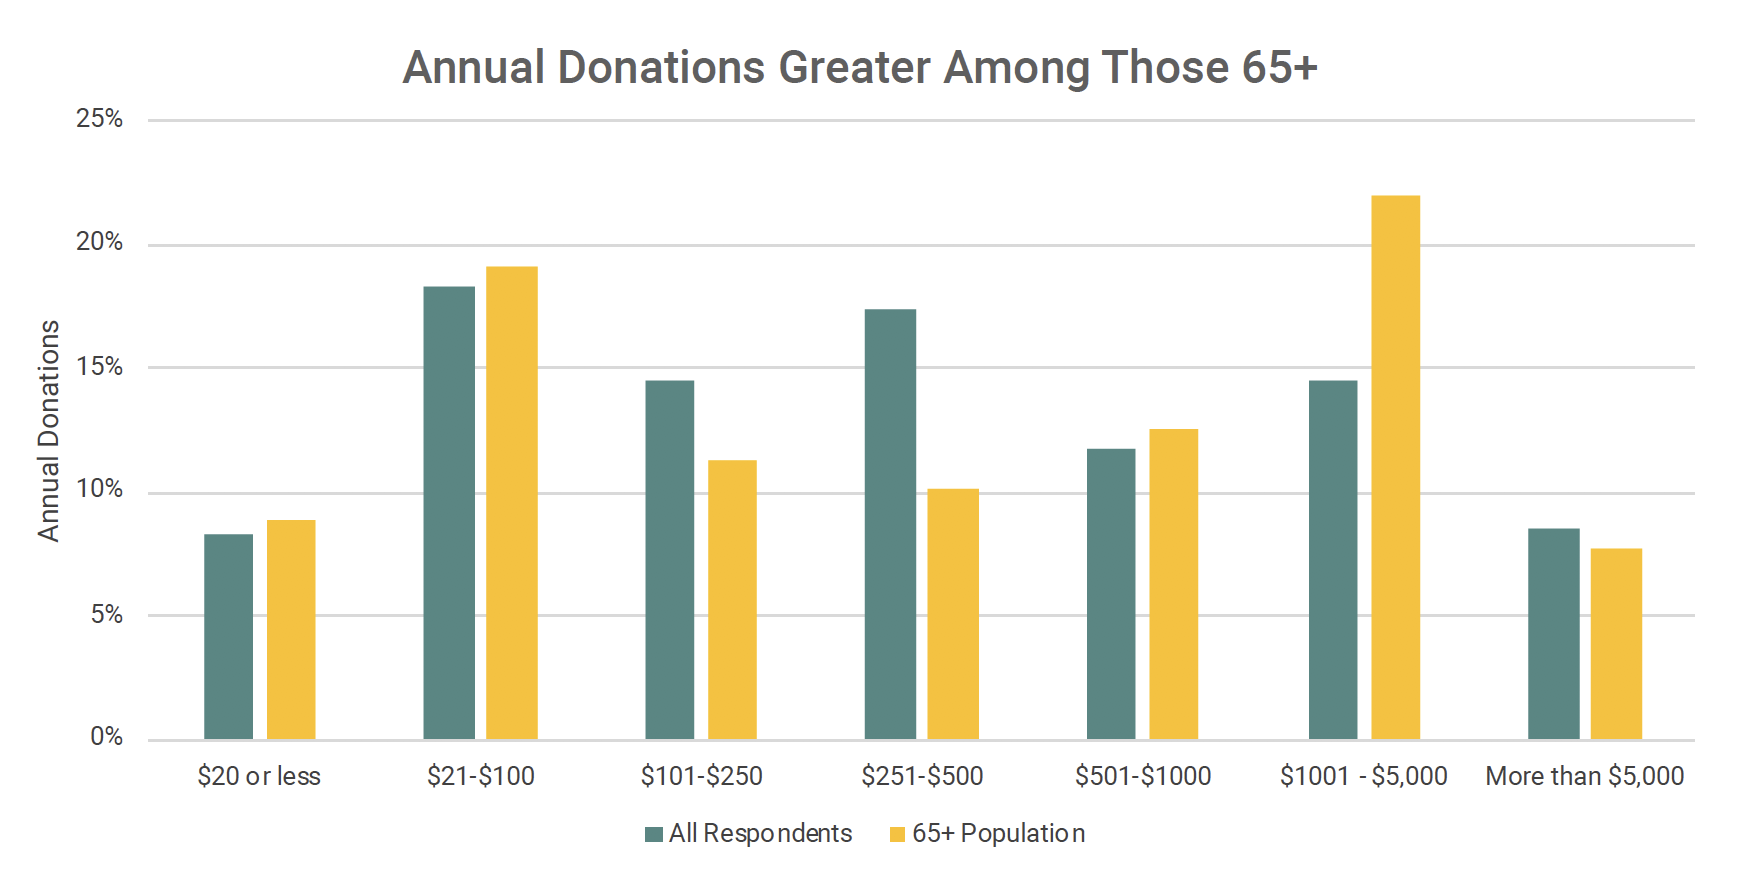
3. Older Population Gives at a Greater Rate… and Gives More
Whereas 81% of all respondents have donated in the past, the 65+ category has donated at a higher rate, 91%. The median annual giving level is $251- $500 for all respondents. The 65+ population gives up to double that with a median giving level of $501-$1,000/year.
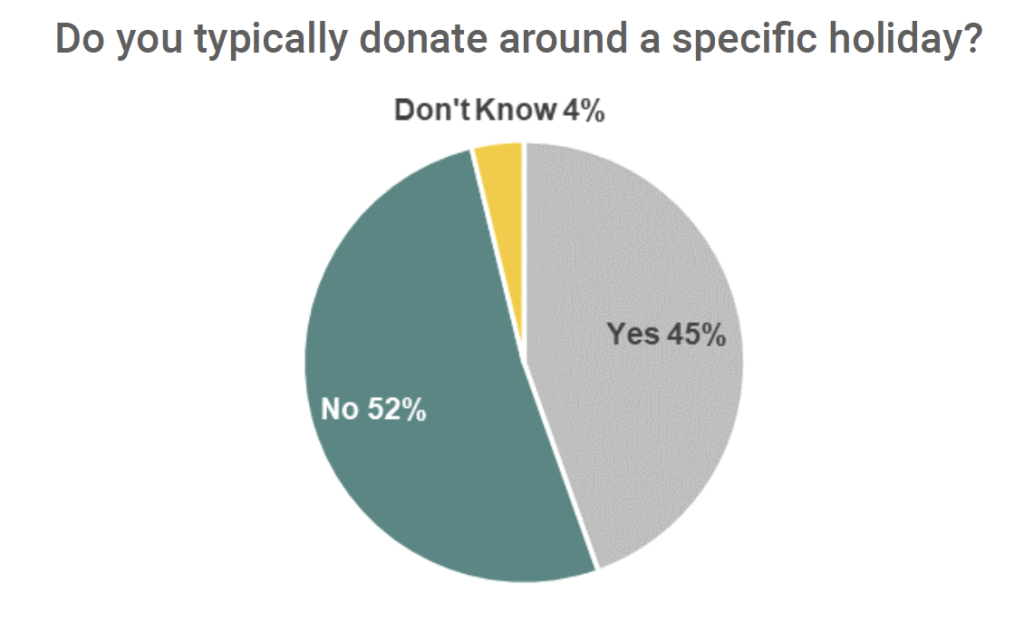
4. Holiday Giving is Important, but Opportunities Exist Throughout the Year
45% typically give around a holiday, particularly around Christmas and Thanksgiving. Conversely, about half of the population gives throughout the year, so on-going communication is still key.
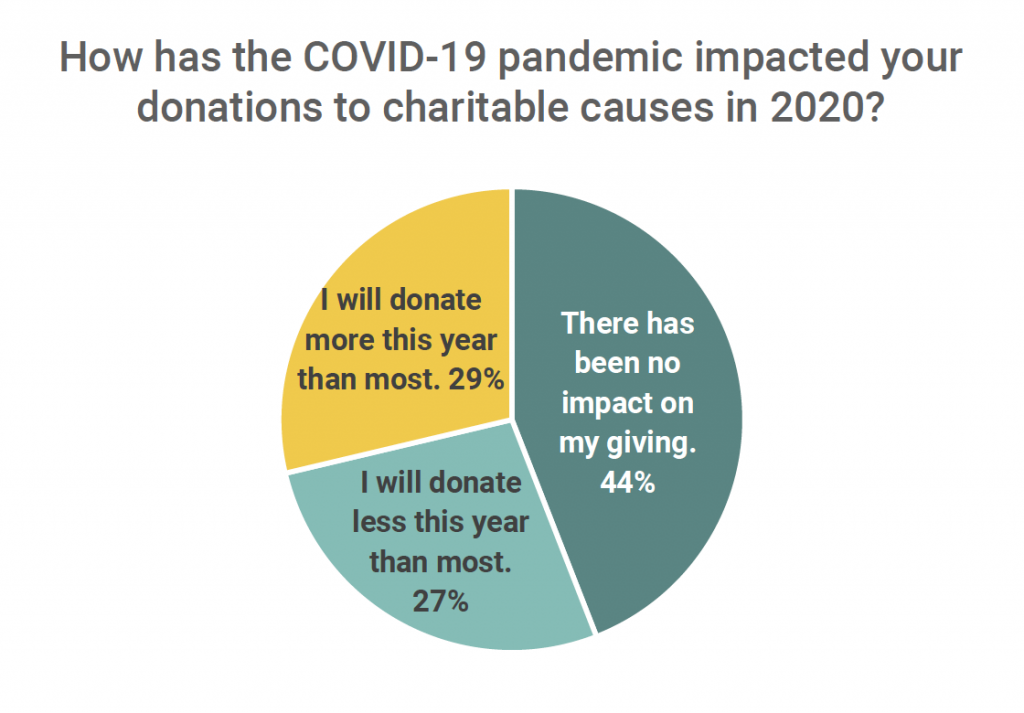
5. The COVID-19 Pandemic Has an Impact on Giving for Most
56% of respondents said that the pandemic had an impact on giving in 2020, but it’s not what you might think. Roughly half of them said that they gave more than they would have; the other half, less.
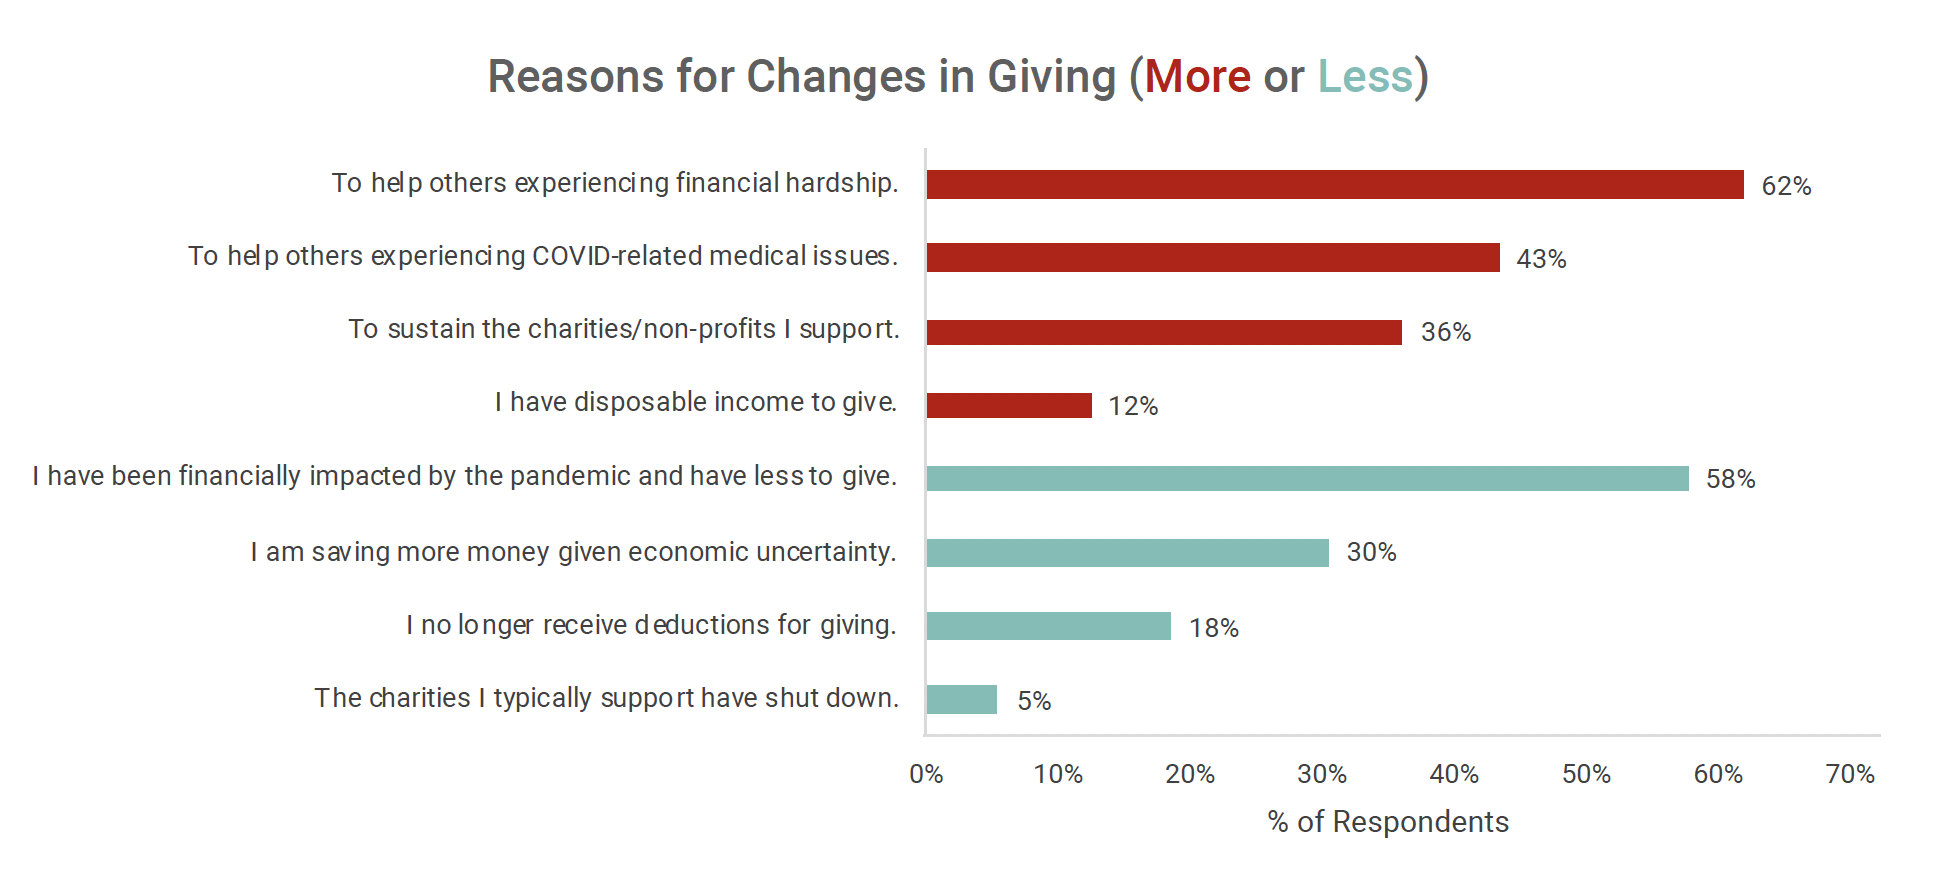
Of those who gave more, most said they were helping others in financial hardship (62%). Others were concerned about helping those with COVID-19 (43%) or sustaining the charities they support (36%). Most who gave less said they had been financially impacted by the pandemic and had less to give (58%). About a third felt they needed to save their disposable income given economic uncertainty.
Future Giving
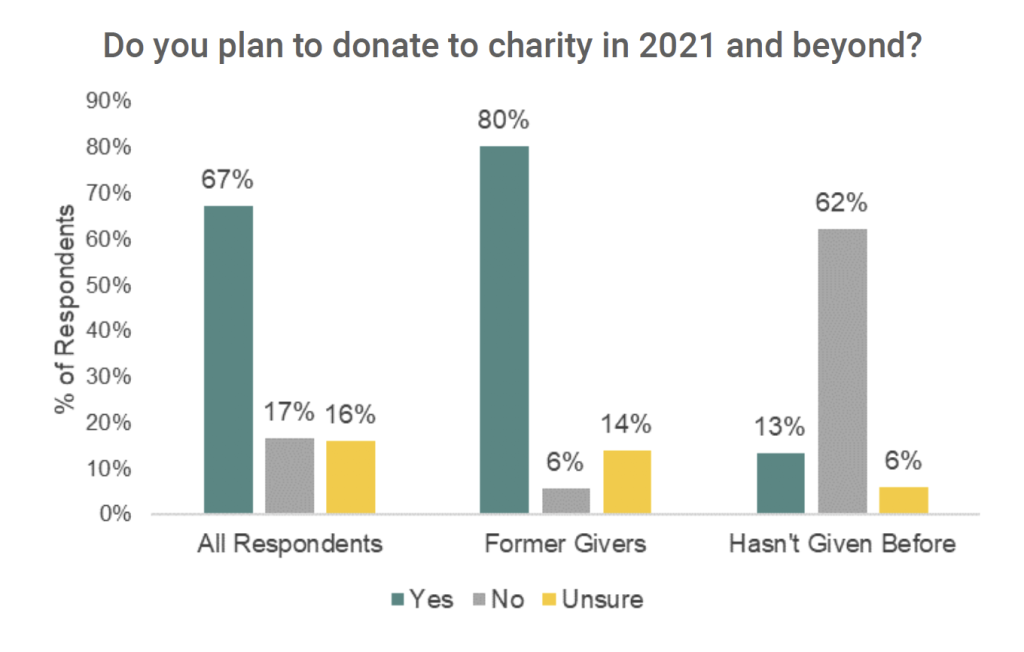
6. Past Donations Do Not Necessarily Predict Future Donations
While 81% have donated in the past, only 67% plan to donate in 2021. The gap can be explained by uncertainty in what the future holds (e.g., economic instability, financial concerns).
However, those who did not donate in the past are still unlikely to donate in the future.
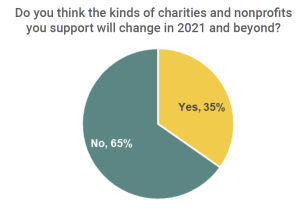
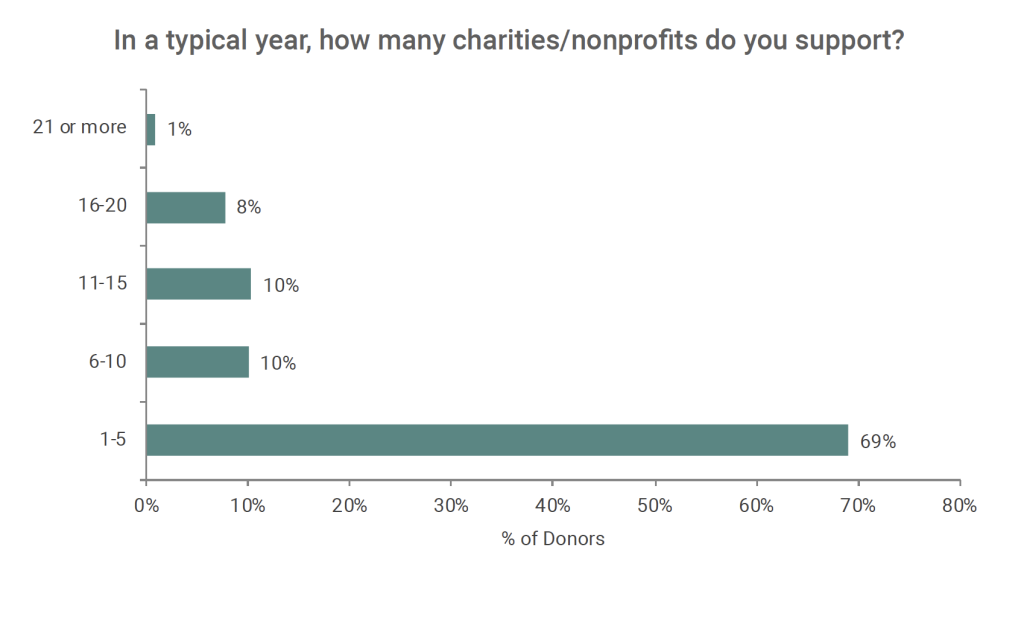
7. While Donors are Consistent with the Charities they Support, Opportunities for New Donations Exist
69% of donors support 1-5 charities per year, and the majority of them give to the same charities year-over-year. However, 35% said they thought the types of charities and nonprofits they support would change in the future.
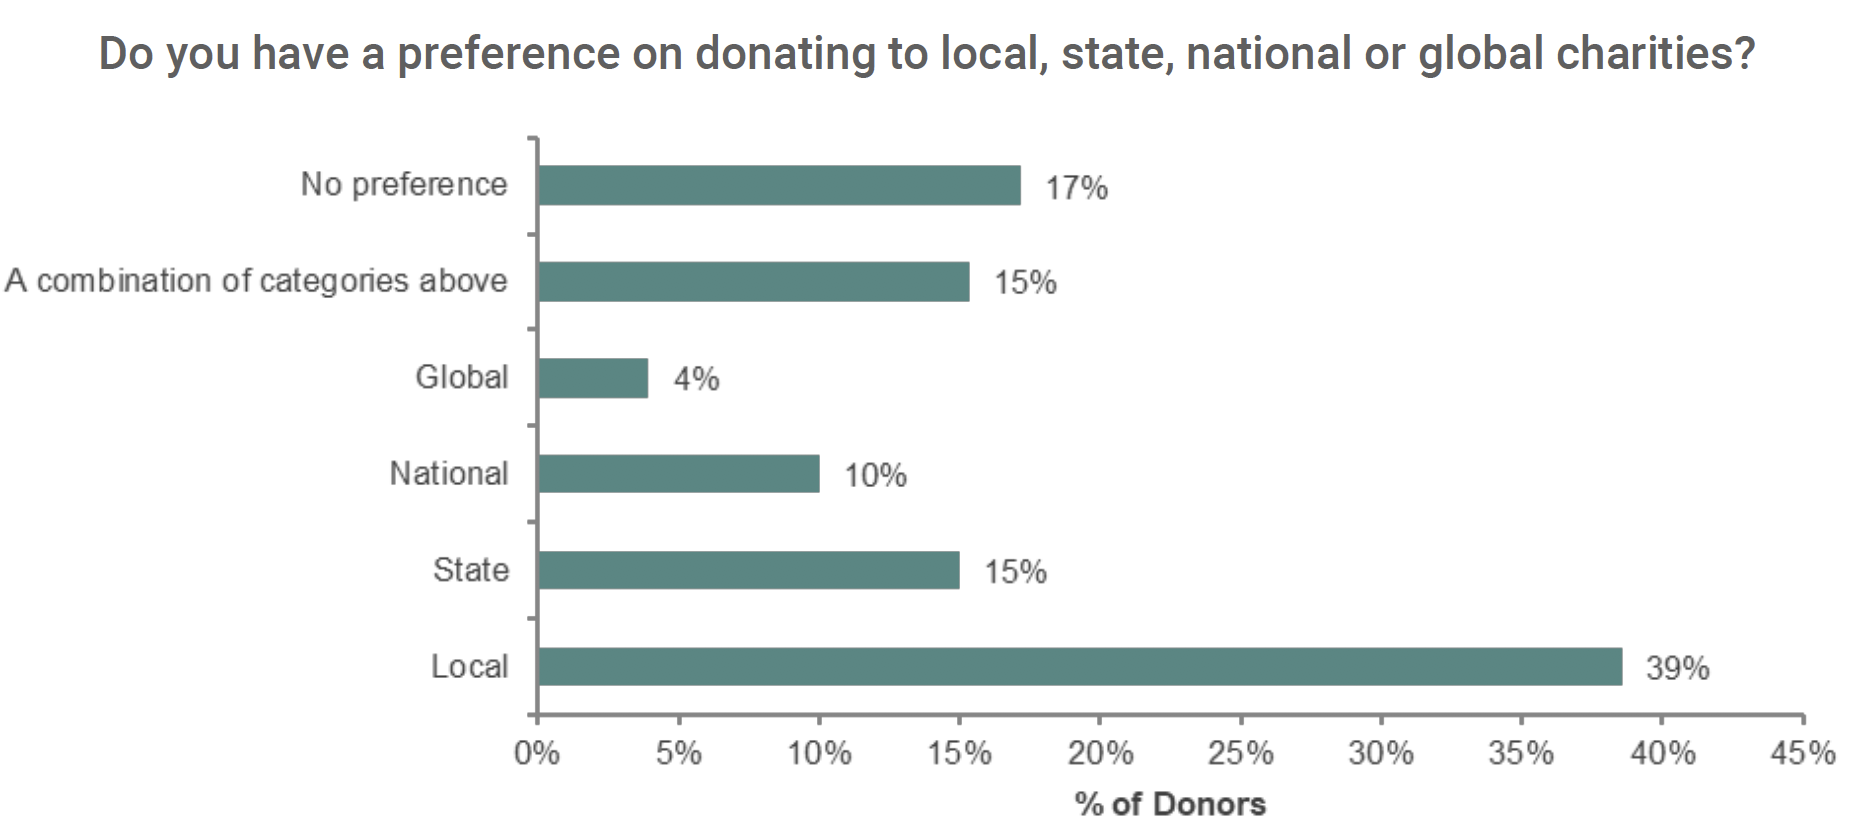
8. Most Prefer to Give to Local Charities
Given local, state, national and global options for giving, the most common preference is “local charities.” This highlights the need for national charities to promote a local angle.
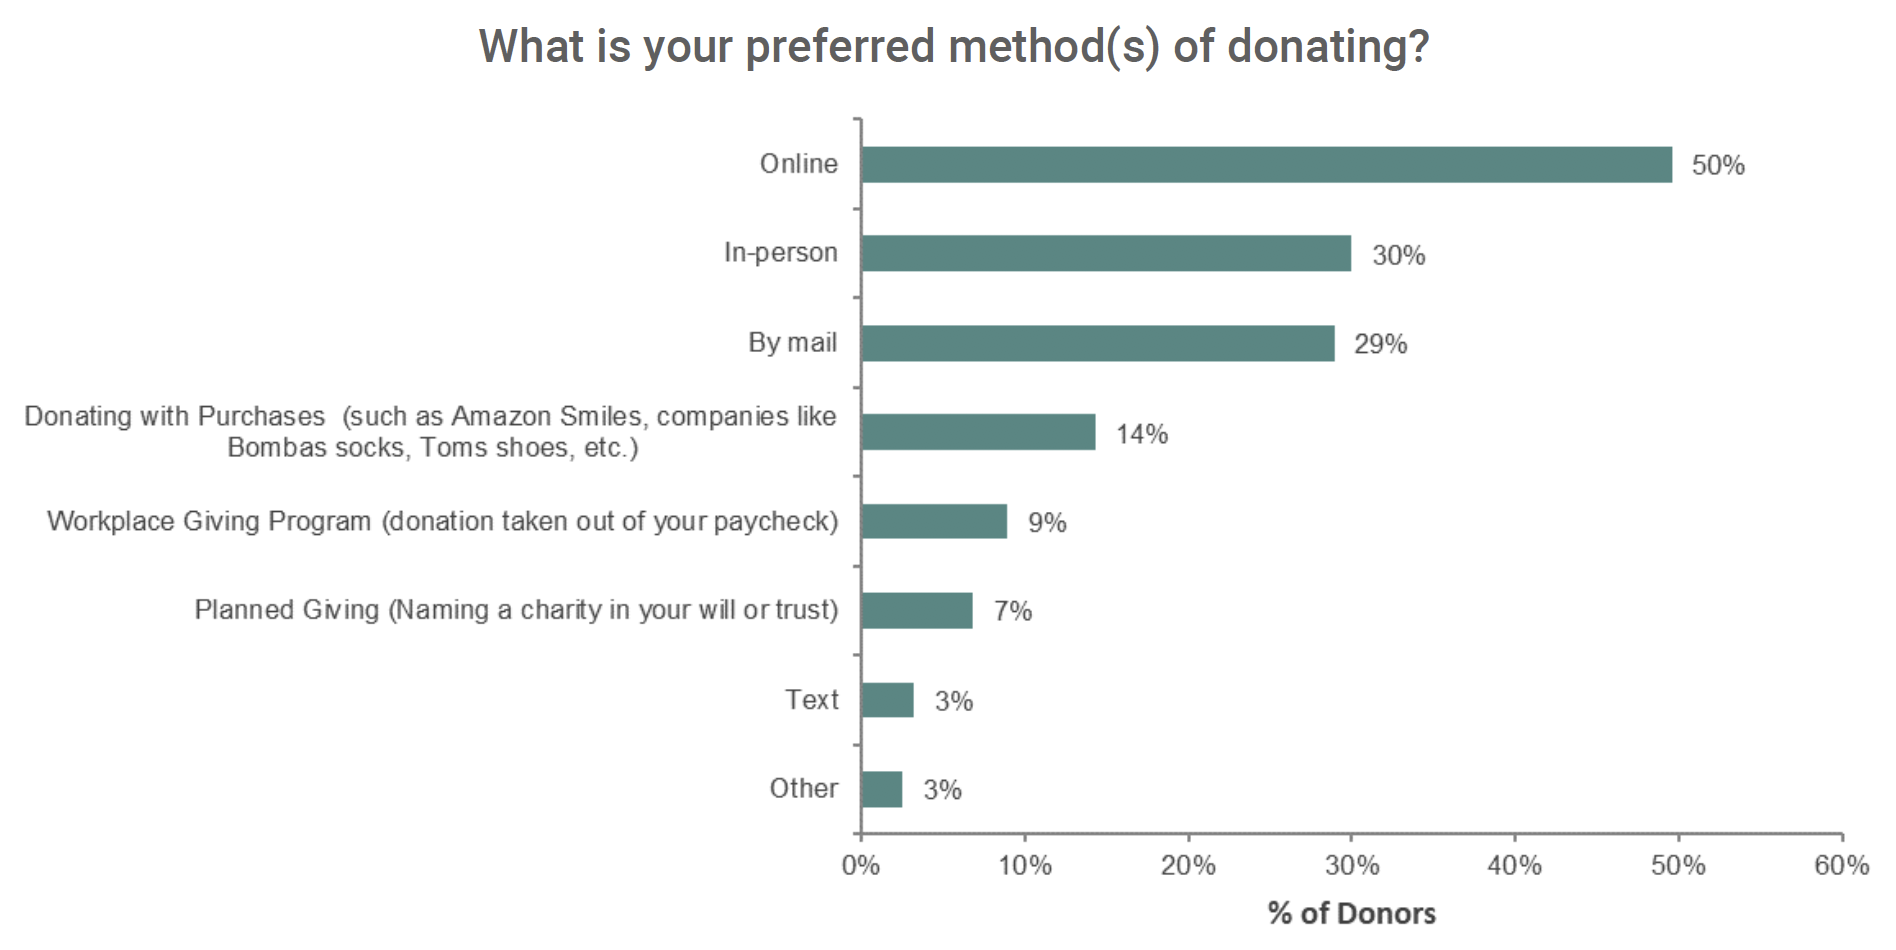
9. Online Giving is Most Popular, but a Multi-Approach is Key
Half said they would prefer giving online to other methods. However, mail and in-person channel preferences were also prevalent. For 2021, don’t count out direct mail and in-person options (post-COVID-19). A multi-media approach is essential.
Communication Preferences
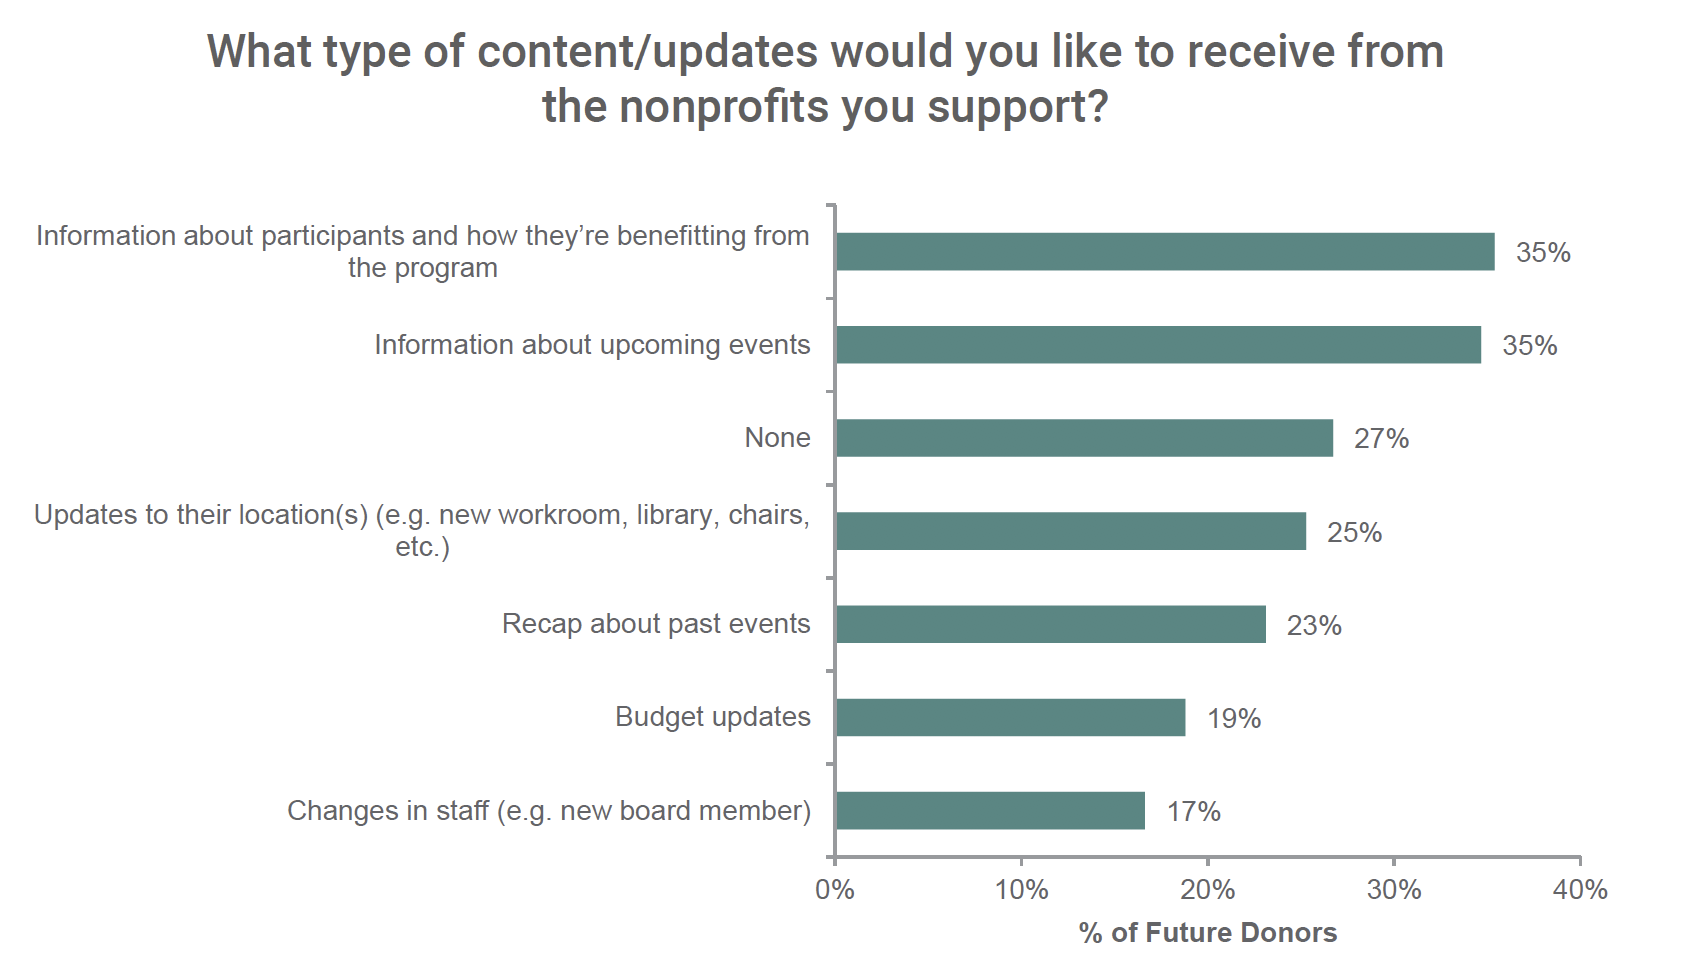
10. Donor Communications Should Focus on End-User Benefits and Upcoming Events
Donors desire updates regarding how participants are benefitting from their contributions, as well as information regarding upcoming events. Budget updates and changes in staff are less important.
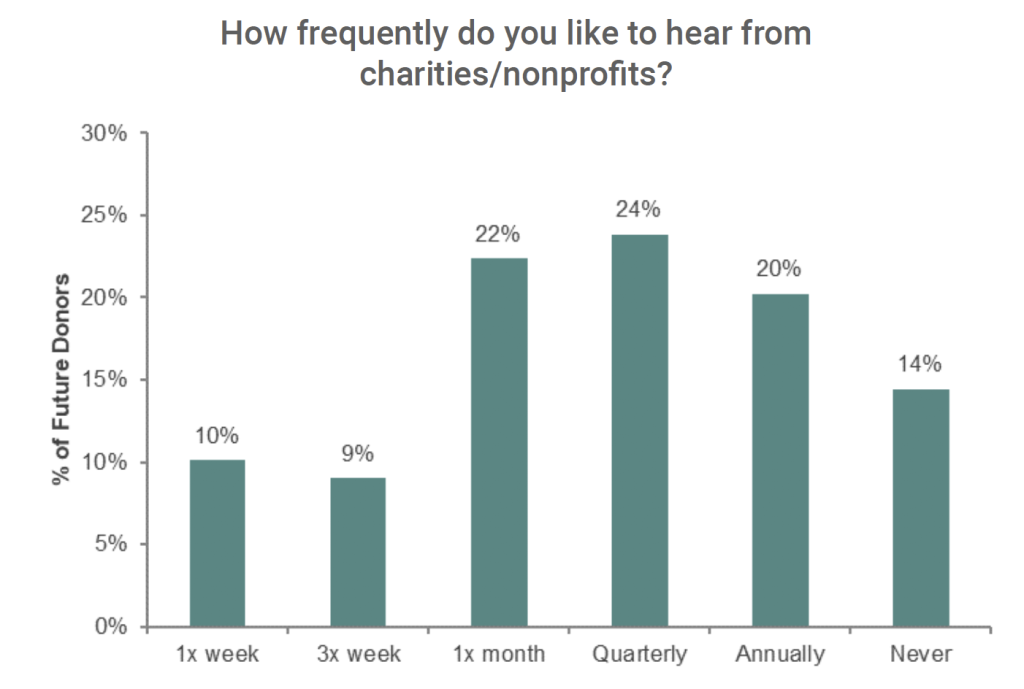
The general population likes to hear from their charities monthly, quarterly, or even annually, but not weekly.
11. Email is the Preferred Communication Method to Stay in Touch and Solicit Donations
About half of respondents (46%) said they prefer that charities keep in touch with them via email. Mail is second (32%) with social media in third (22%). Newsletters/ magazines, a mainstay of nonprofit communications, were preferred by only 6-7%.
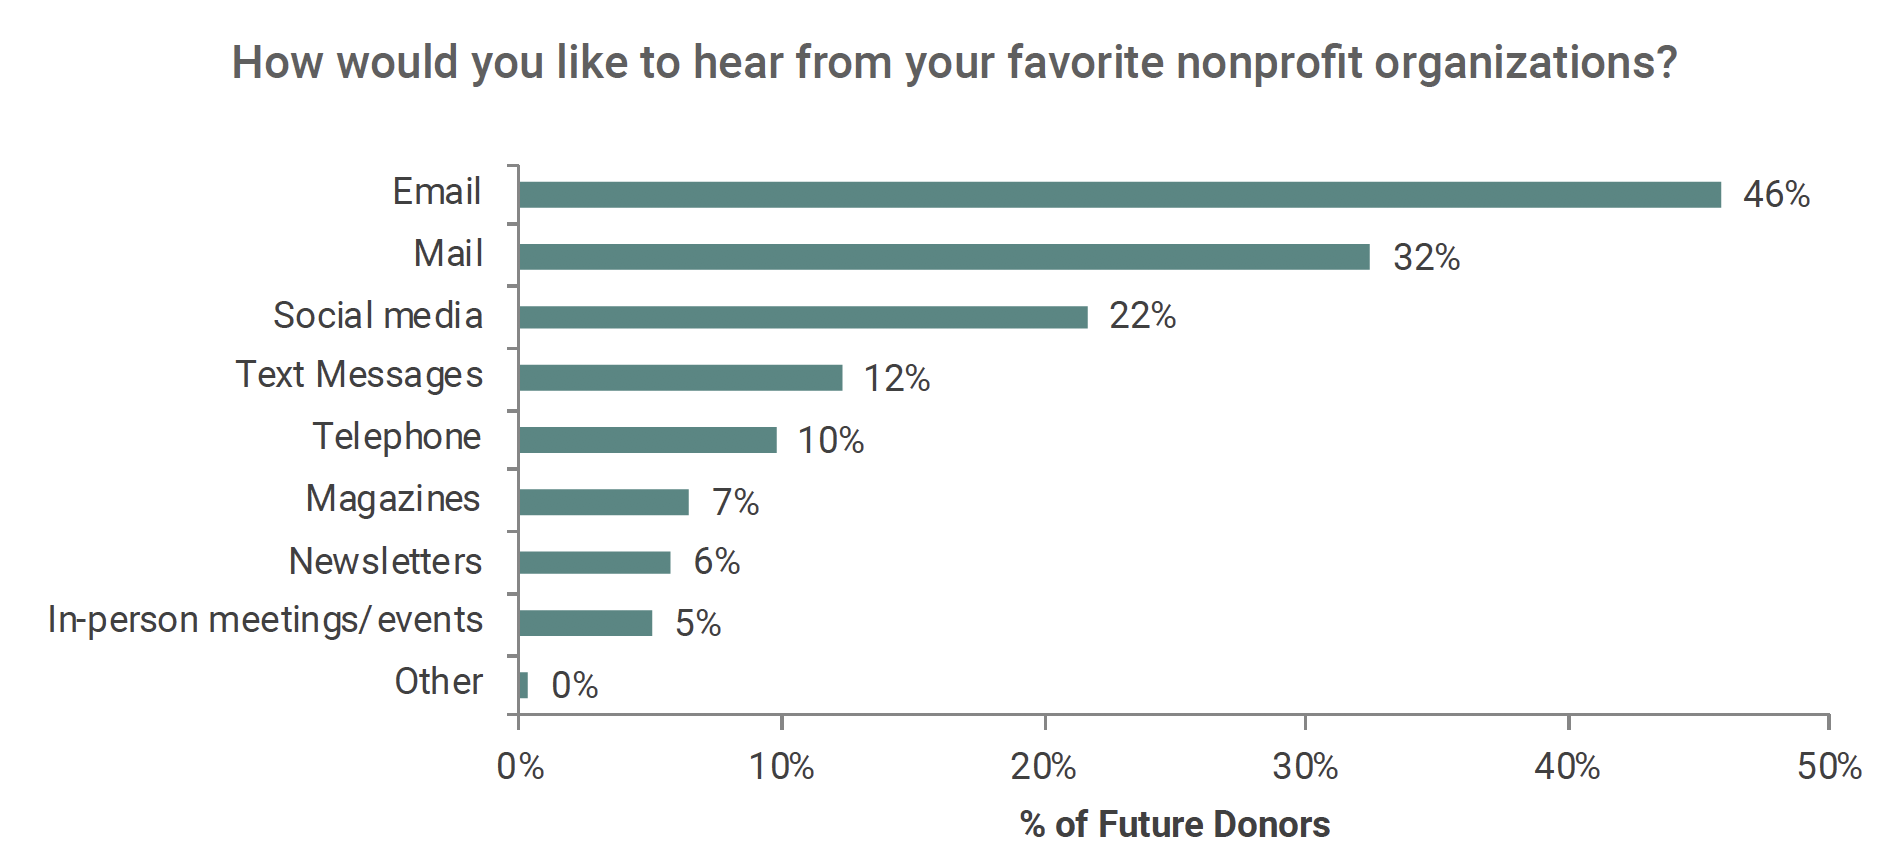
In terms of donation format preferences, email still tops the list followed by direct mail, then social media.

12. A Strong Social Media Presence is Important
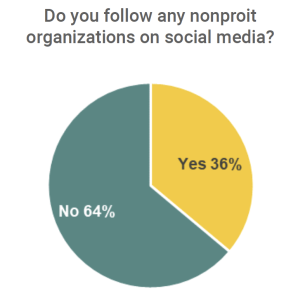
36% of donors said they follow nonprofits on social media, most commonly on Facebook. In fact, 4x as many follow their favorite charity on Facebook than any other social media platform.
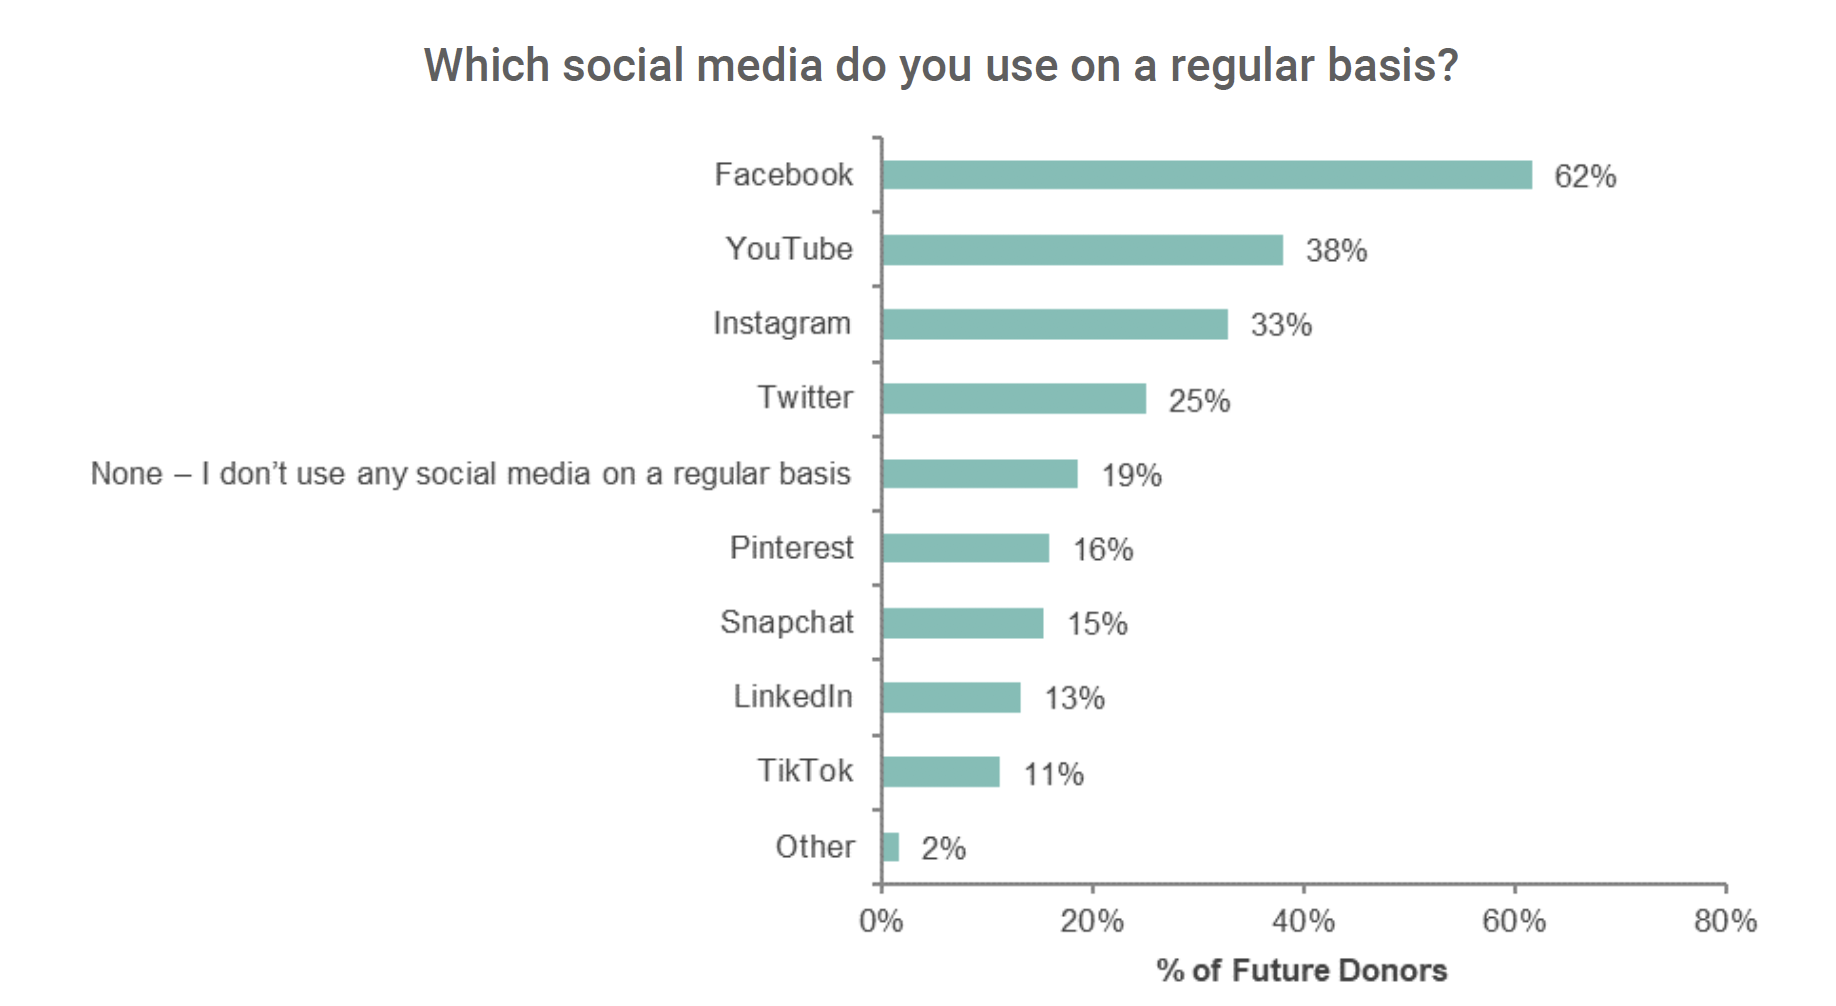
Facebook also tops the list of social media they use on a regular basis (62%). YouTube is next in terms of general usage (38%), followed by Instagram (33%) and Twitter (25%).
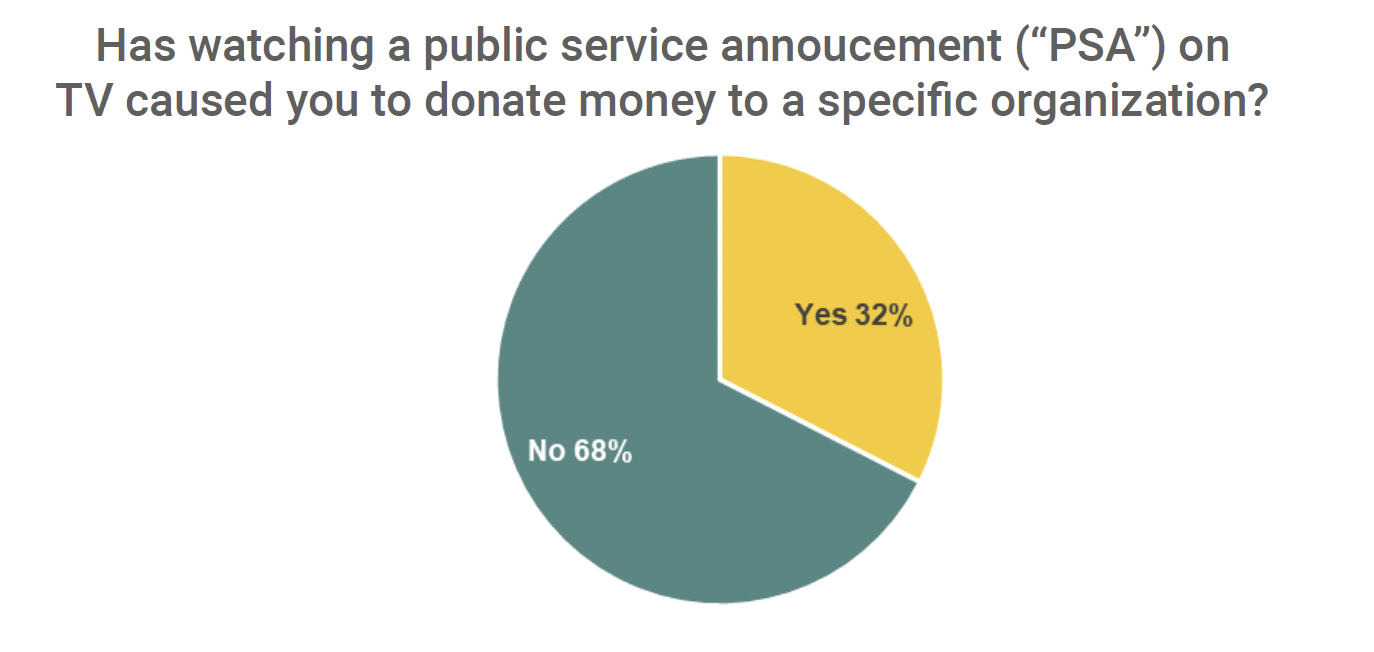
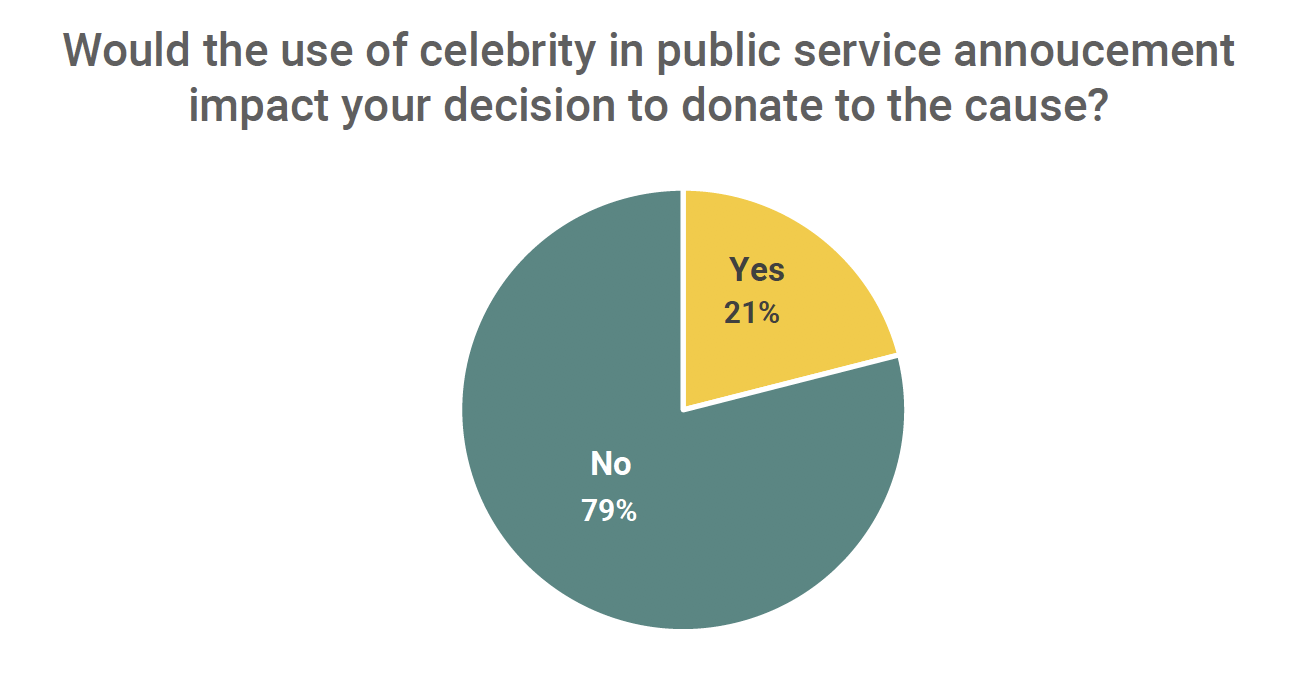
13. Public Service Announcements are Impactful for Donations
32% of donors have given as a result of a public service announcement (“PSA”). PSAs are often the first introduction to potential donors of a charity given their broad reach. According to our survey, 79% of donors said that celebrity representation in the PSA does not impact their decision to donate to the cause.
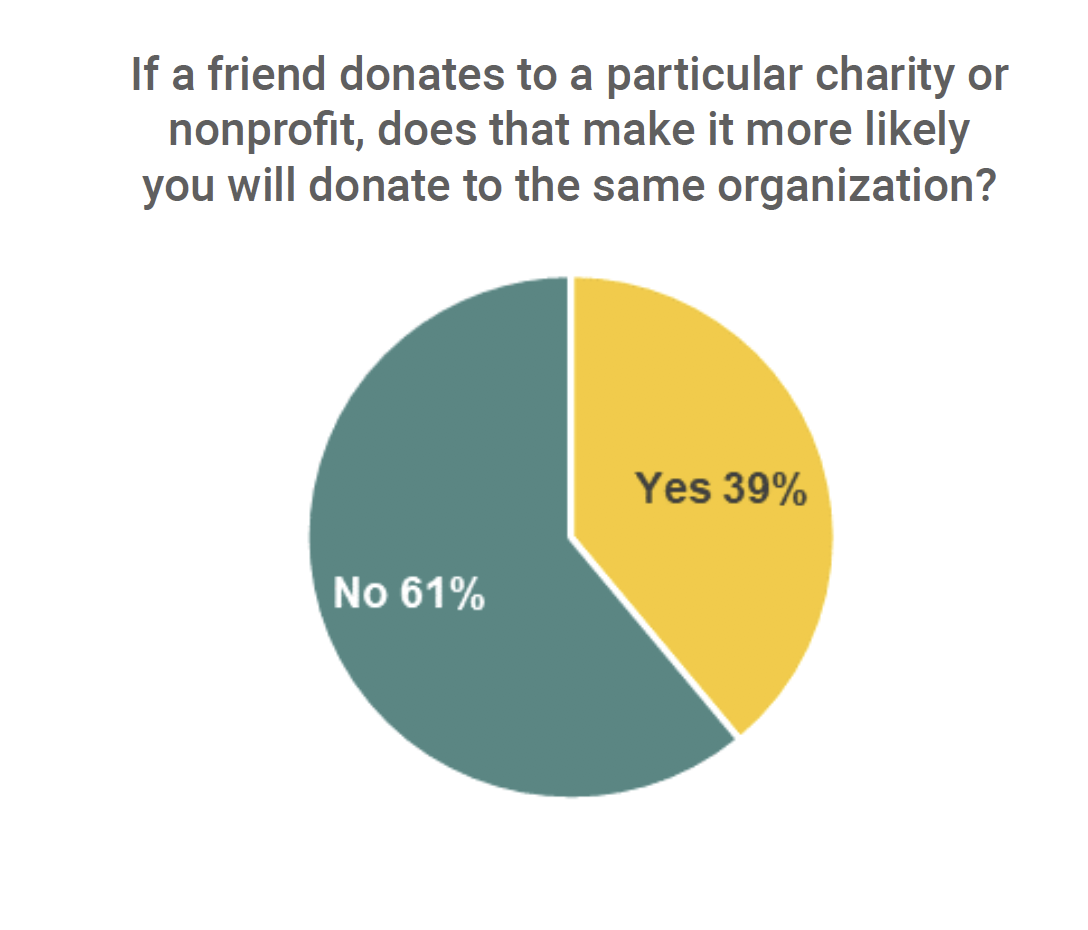
14. Friends Influence Giving
About 4 in 10 said that friends’ donations influenced their own.
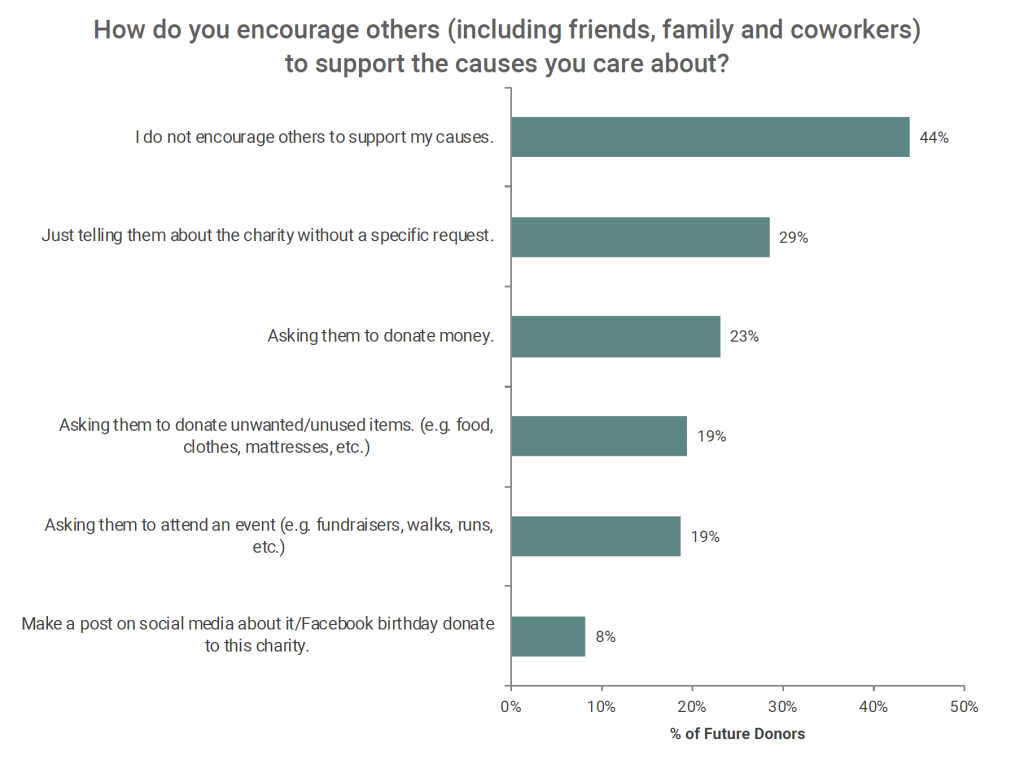
More than half said they encouraged others to support their cause. Typically, they shared information regarding their causes without a specific request, but a sizeable percentage also ask others for financial or non-financial donations.
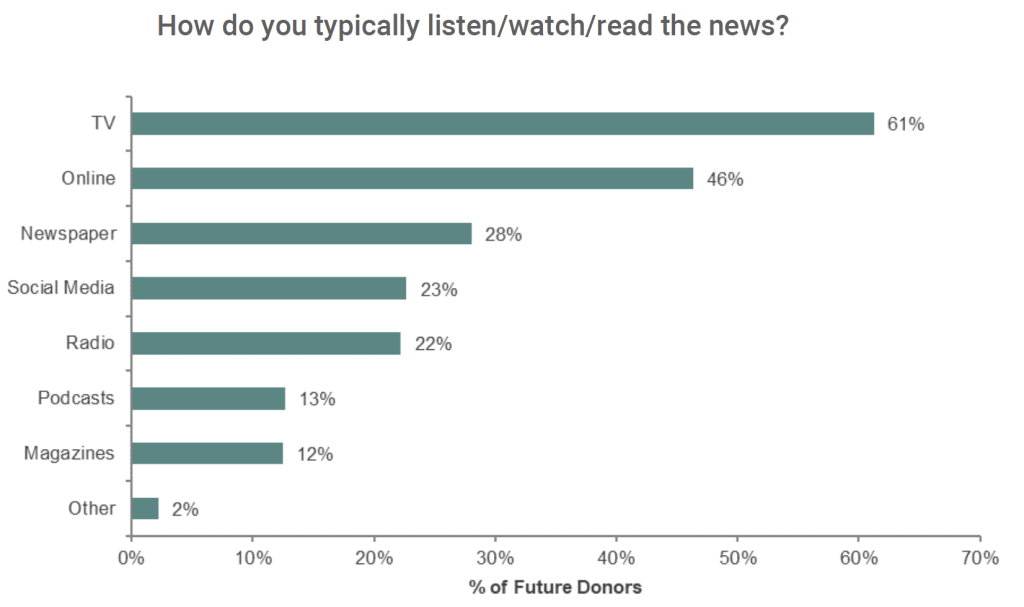
15. TV Remains #1 News Source
Most people get their news by watching TV (61%). Online news was next (46%), followed by newspaper (28%), and social media (23%) and radio (22%). Magazines and podcasts are also in the mix. While relatively few cited podcasts that they listened to, those that did often referenced news, political, true crime, business and educational types.
To view the full 2020 Donor Survey Click Here.