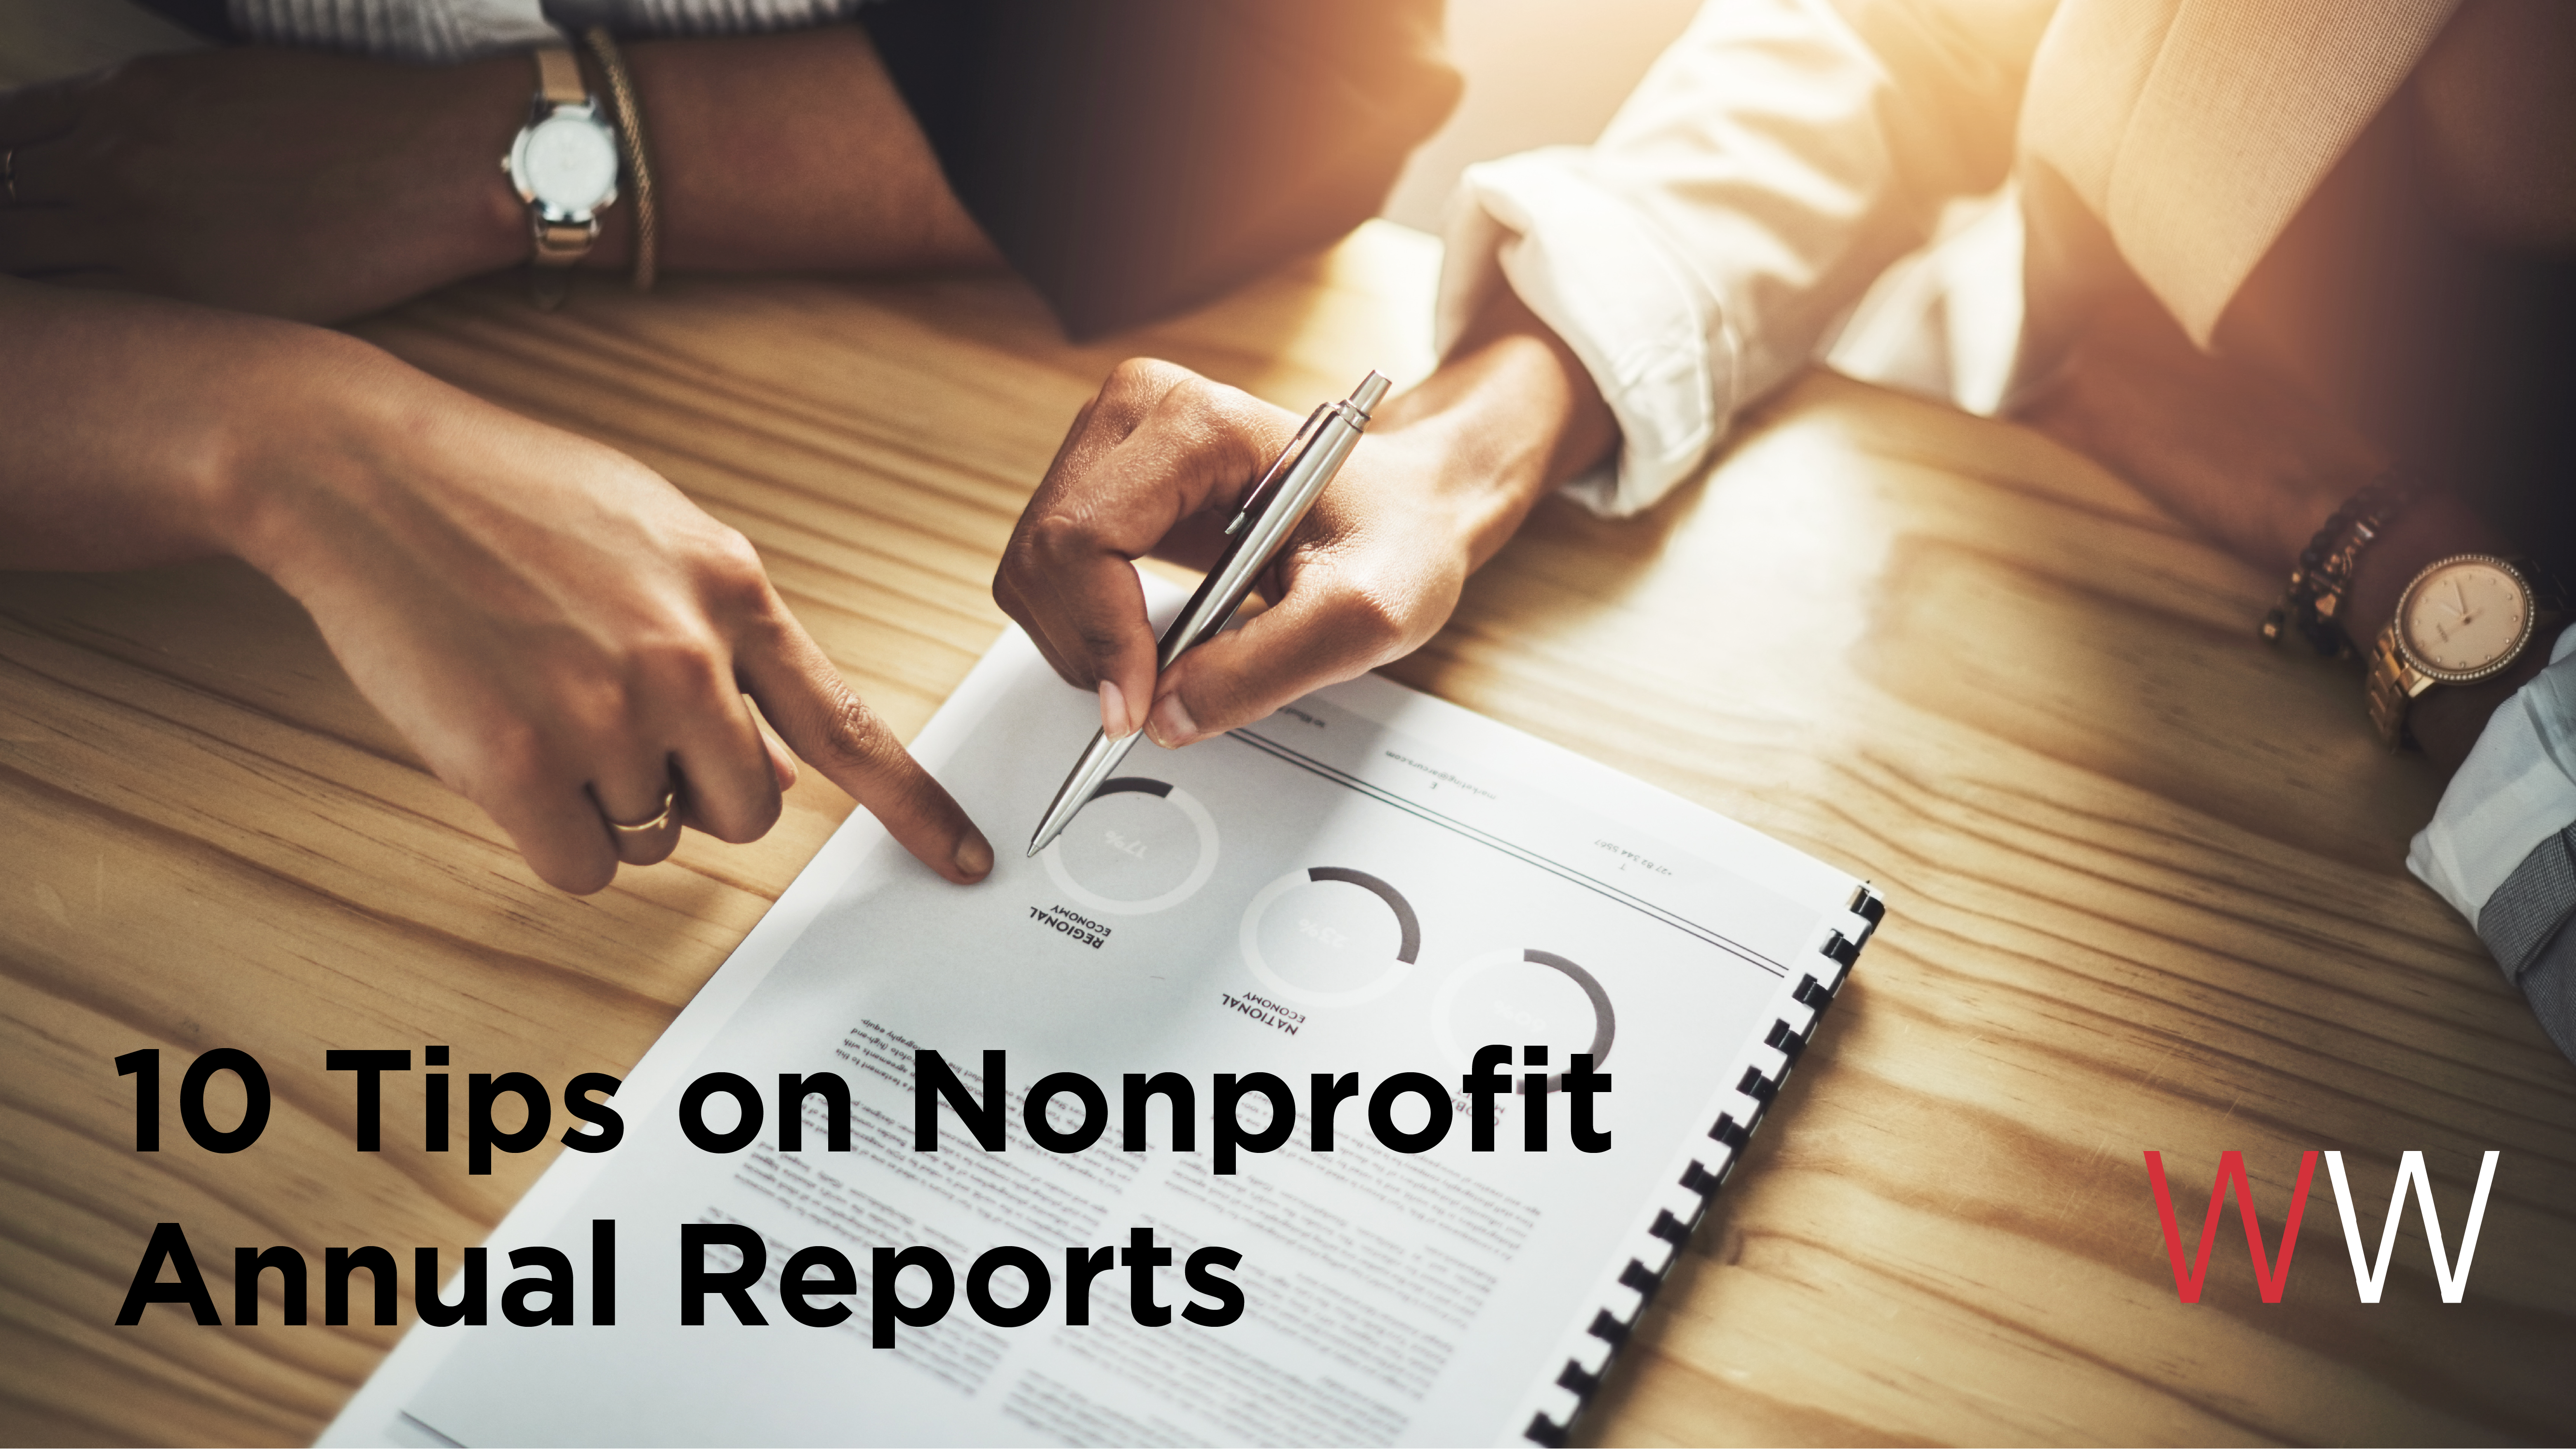
By: Glaelis Sierra – Account Director – Williams Whittle Advertising
The first quarter of the year is a time for resolutions, decluttering, staying warm and getting a head start on taxes. At Williams Whittle, we’re thinking about annual reports. Yes, it’s that time of the year! Time to celebrate your accomplishments and report back on the annual progress toward meeting your mission. Some organizations might still be halfway there (fiscal year – I see you), but others use the regular January through December timeline. Either way, here are a few learnings from our team on these hefty pieces of work.
How to write and design a great one?
Here are 10 useful tips to make them more appealing to a broader audience:
Tip 1 – Consider all types of readers
Keep in mind that not everyone will be able to read the report in the same ways as others. Therefore, you’ll need to contemplate making your document compliant with the American Disabilities Act (ADA).
We’re talking about section 508. Simply stated, ADA compliance means we make every effort to make education accessible to those with disabilities. This includes those who are visually and audibly impaired.
Some of the features of an ADA compliant PDF include:
- Searchable text
- Note: PDFs created by scanning may actually be an image and not searchable text.
- Images with Alt Text (alternative text)
- Alt-text is the hidden text used to describe an image to one visually impaired.
- Bookmarks for documents over 9 pages
- Add tags
- Logical reading order (left-to-right) in tables
- No background images or watermarks
- Table rows that don’t split across pages
- Font size should be at least 16 pts
- Some typefaces that are typically ADA-friendly include Tahoma, Calibri, Helvetica, Arial, Verdana and Times New Roman
- There should be an appropriate color contrast between the background and text
- There are color contrast analyzers that you could download to scan your document. Check this out with this free tool.
For a list of ADA compliant PDF requirements, click here. To learn more about ADA, please visit adata.org They host events to help people create accessible documents and understand the requirements to comply with the law.
If you’re using Adobe Acrobat Pro to prepare the final PDF, the program has tools to verify accessibility. For a quick reference guide on how to check if your file is accessible, click here.
Tip 2 – Eliminate the Table of Contents on Shorter Reports
If your annual report is less than 25 pages, you don’t need a table of contents. Instead, treat each page as a one-pager that could stand alone. That way, each page will be a beginning and an end, and the reader can flow easily from page to page.
Tip 3 – Cut Down Your Content
This seems counterintuitive, but it will help keep the annual report readable and succinct. Even the person who is willing to read every word in your annual report will get overwhelmed by too much content. So, when you’ve finished copywriting and editing, a rule of thumb is to cut the copy by at least 25%.
Tip 4 – Avoid Standard Layouts
An easy way for your annual report to stand out, get noticed and remembered is to stay away from standard layouts like 8 1⁄2 x 11” sizes or newsletter-type page layouts. Also, don’t be afraid of a full page of just a photo and a few words.

Example of our MRC client’s 2018 annual report with a two-column style.
Tip 5 – Invest in Good Imagery
It’s no lie that a picture can tell a thousand words. Use good imagery throughout your annual report – images that have one main subject, no more than two people and are high-resolution.
Tip 6 – Tell Your Story Visually
Ultimately, annual reports are fundraising vehicles. Don’t just recount the past year’s highs and lows like a corporate annual report. Instead, tell your story with subtle facts, figures, stories and reports from the previous year.
Graphics – Sometimes it’s better to tell the story visually rather than reading a bunch of numbers. Graphics are easier on the reader and help you ‘paint’ the story.

Conclusion page that highlights the program’s successes with graphics.
Maps – What areas do you cover? Where will you be next? Maps can help the reader visualize geographic coverage. Instead of saying ‘we have over 130 collection sites in your state’ show it with a map.

Heat map to show PSA airings in California. Clickable links include PSA creative, plus images of the spots that were referenced in the narrative.

Another creative way to show locations on a map.
Images and Pictures – Images help tell a story and humanize the work you do.

Pictures from events our client attended in 2018.

Icons that pop on the text. These icons represent components of a mattress that can be recycled.
Tip 7 – Turn Numbers into Graphics
Let’s face it, readers want to get to the hard facts quickly and painless. Then, they want to be blown away. Statistics and financials are more easily digestible in charts and infographics that offer a colorful and simplified visual.
Use tables and charts to show numbers, compare growth year over year and show financial data, among other data that would be better explained with a chart or table. Data visualization is key.

Table and pie chart from our MRC client’s 2018 annual report.
Tip 8 – Use Emotion
Emotion always trumps facts and figures. Keep top-of-mind that you want all of your annual report content to focus on your mission. How are you delivering that mission? How are you changing the world? How are you changing lives?
Tip 9 – Don’t be Afraid of White Space
When there is too much content on the page there is no focal point for the reader. No visual roadway. So, often, they skim and move on. White space is good. It helps cut down on clutter. Don’t limit the size of your document so that each page can breathe and not get filled to the brim.

Here’s an example of our client MRC’s annual report for Connecticut. Notice how the creative is the focal point on this page, while still providing data on their paid advertising campaign.
Tip 10 – Don’t Print… Go Digital!
OK, we know, you will probably have to print some amount of annual reports, but consider more current ways of presenting your document. And a PDF doesn’t count – the file size is often too large to email or takes too long to download. Instead, think digital. You’ll want to make it easy for anyone to read online, on their mobile or their tablet. Try an online publication publisher like Treesaver, Issuu or ZMags. Also, you can summarize on a webpage with links to one-page PDF downloads.
Some of these tips and ideas described above could even be repurposed for social media posts.
Our client the Mattress Recycling Council (MRC) submits three annual reports each year. One for each state where they operate the Bye Bye Mattress program. During the last few years, we’ve gotten to be well versed in all the requirements of creating an ADA compliant PDF and work with the best designers to make sure the document is not only accessible but good looking too.
To check out our most recent work, visit williamswhittle.com/work/portfolio.