Each month we track the performance of our client campaigns through data analysis. Using tools such as Google Analytics and Google Ads, Facebook, Instagram, Twitter, and YouTube Ads Manager, we track data and present it visually in the form of a dashboard. Getting started creating a dashboard can be daunting, so we will share some of the metrics we track and the importance of each.
There are many types of dashboards that can be developed to track campaign efficacy. The top two that we complete each month for our clients are website analytics and social media analytics. Because we specialize in PSAs, we also create PSA dashboards for our PSA clients.
This is the first post in a four-part series on data. Today, we will focus on presenting website analytics in a dashboard format. In future posts, we will cover social media, PSAs and overall data visualization.
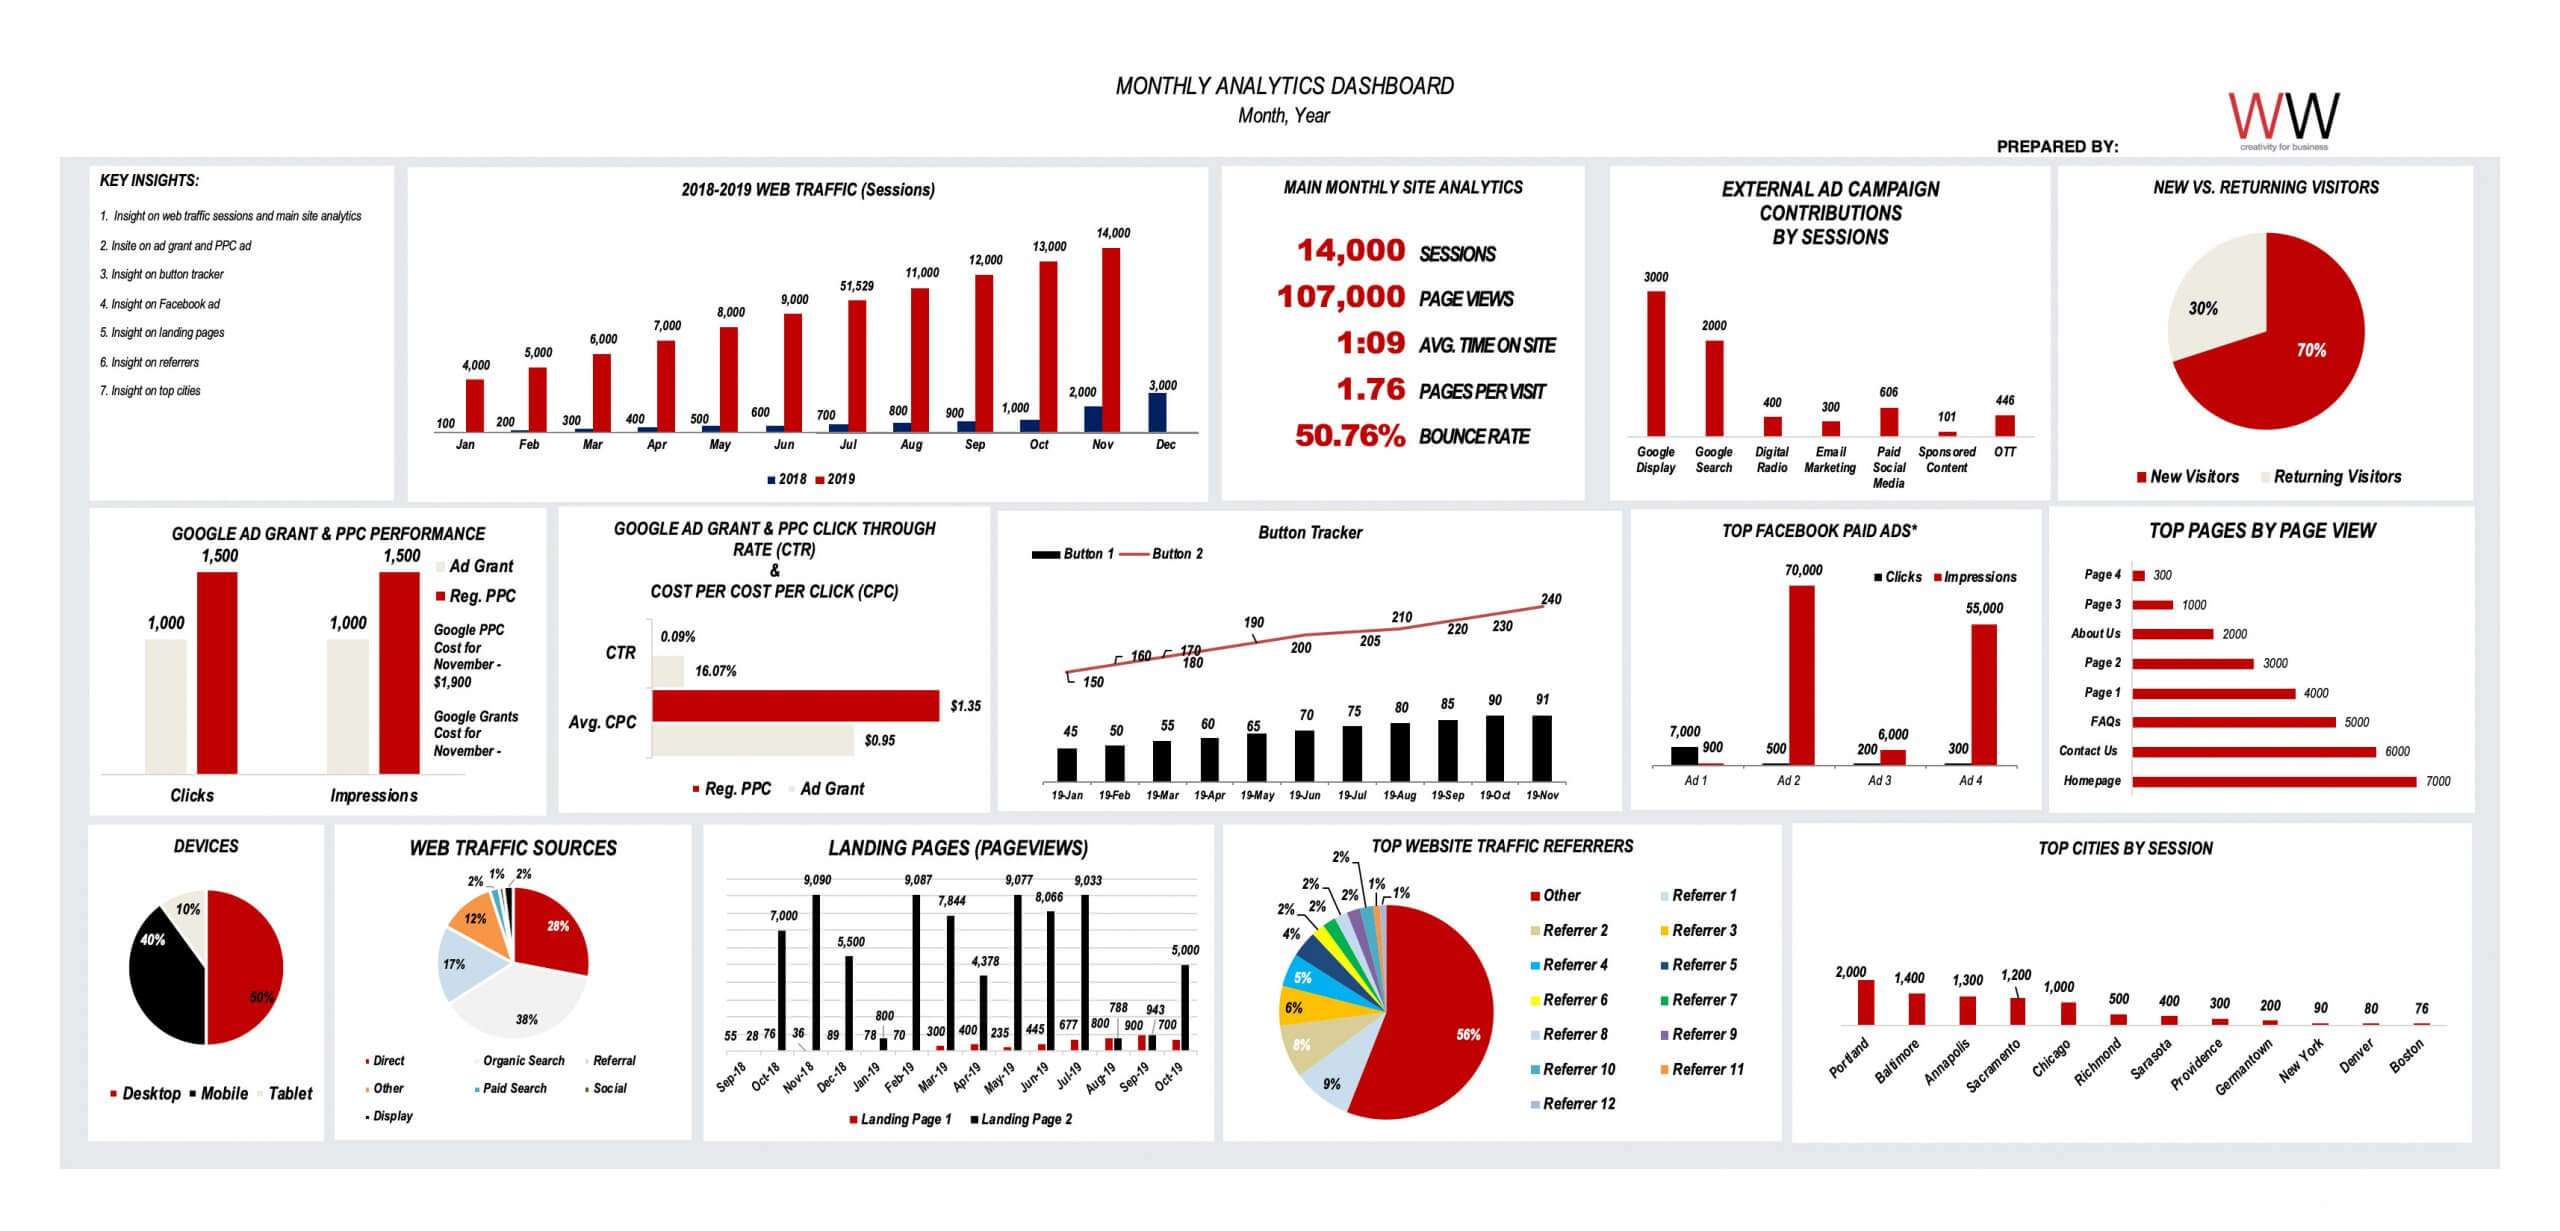
We track the following metrics each month against the month prior:
Sessions are the number of interactions a user has while actively engaged with your website. Sessions (formerly called visits) ebb and flow based on seasonality for your product/service and the advertising you have in market, so looking at monthly increases and/or decreases is important to measure your progress.
Pageviews are the number of pages of your website users viewed. A high number of page views can be attributed to the quality of your site content. Or it could mean that visitors cannot find what they are looking for, so this is important to monitor.
Users & New Users – Users (also called visitors) are those who have initiated at least one session in a given time period. New users are first time users to the site. It is interesting to see if there are fluctuations in new users visiting your site compared to returning visitors coming back to access content. Tracking this allows you to see if you are building a following. Depending on your organization it may make sense to have more new users because your site is something they need to access once for information and may not need to revisit.
Time on site measures the length of time a user stayed on your site. This is important if you have a wide range of content that you want to be viewed on your site. However, if your site is utilitarian and users just need to do one action, the time on your site may be lower.
Pages per visit/session are the average number of pages accessed during a session. This number helps you determine how well a visitor navigates your content, ideally on the path to conversion.
The bounce rate is the percentage of single-page sessions in which there was no interaction with the page. Bounce rates vary from site to site, but once a baseline is established, you will know when you need to optimize to help convert visitors. Bounce rates are always higher for mobile. You want mobile visitors to get the information they need quickly.
Tracking Landing Pages allows you to drill down more specifically and track visits labeled as sessions in Google Analytics. For our clients, we track landing pages that marketing campaigns have been directing to or different calls to action on the webpage to see which is most effective.
Devices refer to the way in which a user accessed your site either via desktop, mobile or tablet. Mobile currently accounts for about half of all web traffic worldwide, so it is essential that your website is mobile optimized.
Monitoring web traffic sources and referral traffic, allows you to understand how and from where your followers are accessing your site. We include a breakdown of these different types of web traffic sources on our dashboards. For most of our nonprofit clients, organic search is the primary source of web traffic, followed by direct, then paid search or referral traffic from 3rd party sites, and finally paid and/or organic social media.
Organic Search occurs when a user searching for a related term on a search engine is suggested to your website and they click on the link. Organic search is unpaid.
Direct traffic occurs when a user types the address to your website directly into their browser. Direct traffic assumes that users know your website address, so it can be a good measure of brand awareness and can aid in tracking awareness over time.
Referral traffic occurs when your site was listed on another site and a user clicked on the link. To get a better sense of the other sites that are referring to yours, consider tracking your top referrers and note how they change month to month. This can help you gauge the effectiveness of existing partnerships and gain ideas on new partnerships that could enhance your marketing efforts.
Paid Search occurs when a user accesses your site via a listing in search engine results because of a paid keyword.
Social traffic occurs when a user accesses your site from a social network like Facebook, Twitter or Instagram.
Display traffic occurs when a user accesses your site via a paid banner ad.
Top Cites by Session tracks the location of users that are accessing your site. This can help you improve the content and timing of adding content to your site that relates to the users’ geographic location and time zone.
Tracking external ad campaign contributions allows you to measure the effectiveness of marketing efforts in bringing sessions to your website. This is helpful for knowing how to best budget your funds or determine the value of funds spent on different campaigns such as Google Display and Search Ads, digital radio, paid social, email marketing, OTT and more.
Top Pages by View provides insight on the ranking of the most popular pages on your site. This can vary by month depending on situations like new content is being added to a particular page more than others or an ad campaign is driving traffic to a particular page.
Google Grants, Google Ads and Paid Social Performance
Nonprofits are eligible to receive a grant from Google to place ads on the platform. Check out our previous blog on the value of this perk for nonprofits. Nonprofits can also choose to purchase ads to supplement the grants. Here are a few analytics worthwhile to track for both types of ads.
- Clicks refer to the number of times your ad was clicked on.
- Impressions refer to the total count of how many times your ad was seen.
- CTR (Click through Rate) refers to the percentage of times your ad was clicked on compared to how often it was shown to potential site visitors.
- Average CPC (Cost per Click) is a means to understand your return on investment for a paid ad. This value calculates the amount of money spent versus how many clicks it receives. Google Ads will also calculate this for Google Grant Ads even though they are free.
Other relevant data that can be tracked in Google Analytics include demographic and interest reports (affinity for specific topics), age, and gender data. These reports must be enabled in Google Analytics and your privacy policy must be updated to state the Google Advertising Analytics Features that you have implemented. This data is only available for a small subset of your users based on those who are logged into a Google account (i.e. Gmail, YouTube, Chrome, etc.) and from third-party DoubleClick cookies (user tracking cookies).
There are many different metrics that can be tracked by using data collected in Google Analytics, Google Ads and Facebook Ads. Use our guide as a start to determining the best metrics that work for your organization. Over time you may add and remove metrics to suit current campaigns or interests. All of this data helps you better understand the success of your marketing efforts and provides more insights into your target audience.