Social media is an important part of connecting with nonprofit donors, supporters, and volunteers, and a powerful tool for marketers.
Our nonprofit clients use social media to share information about their services, promote events and initiatives, and to engage with partners and stakeholders. Insights from these platforms can help marketers understand their target audiences and ultimately create more targeted content to reach them.
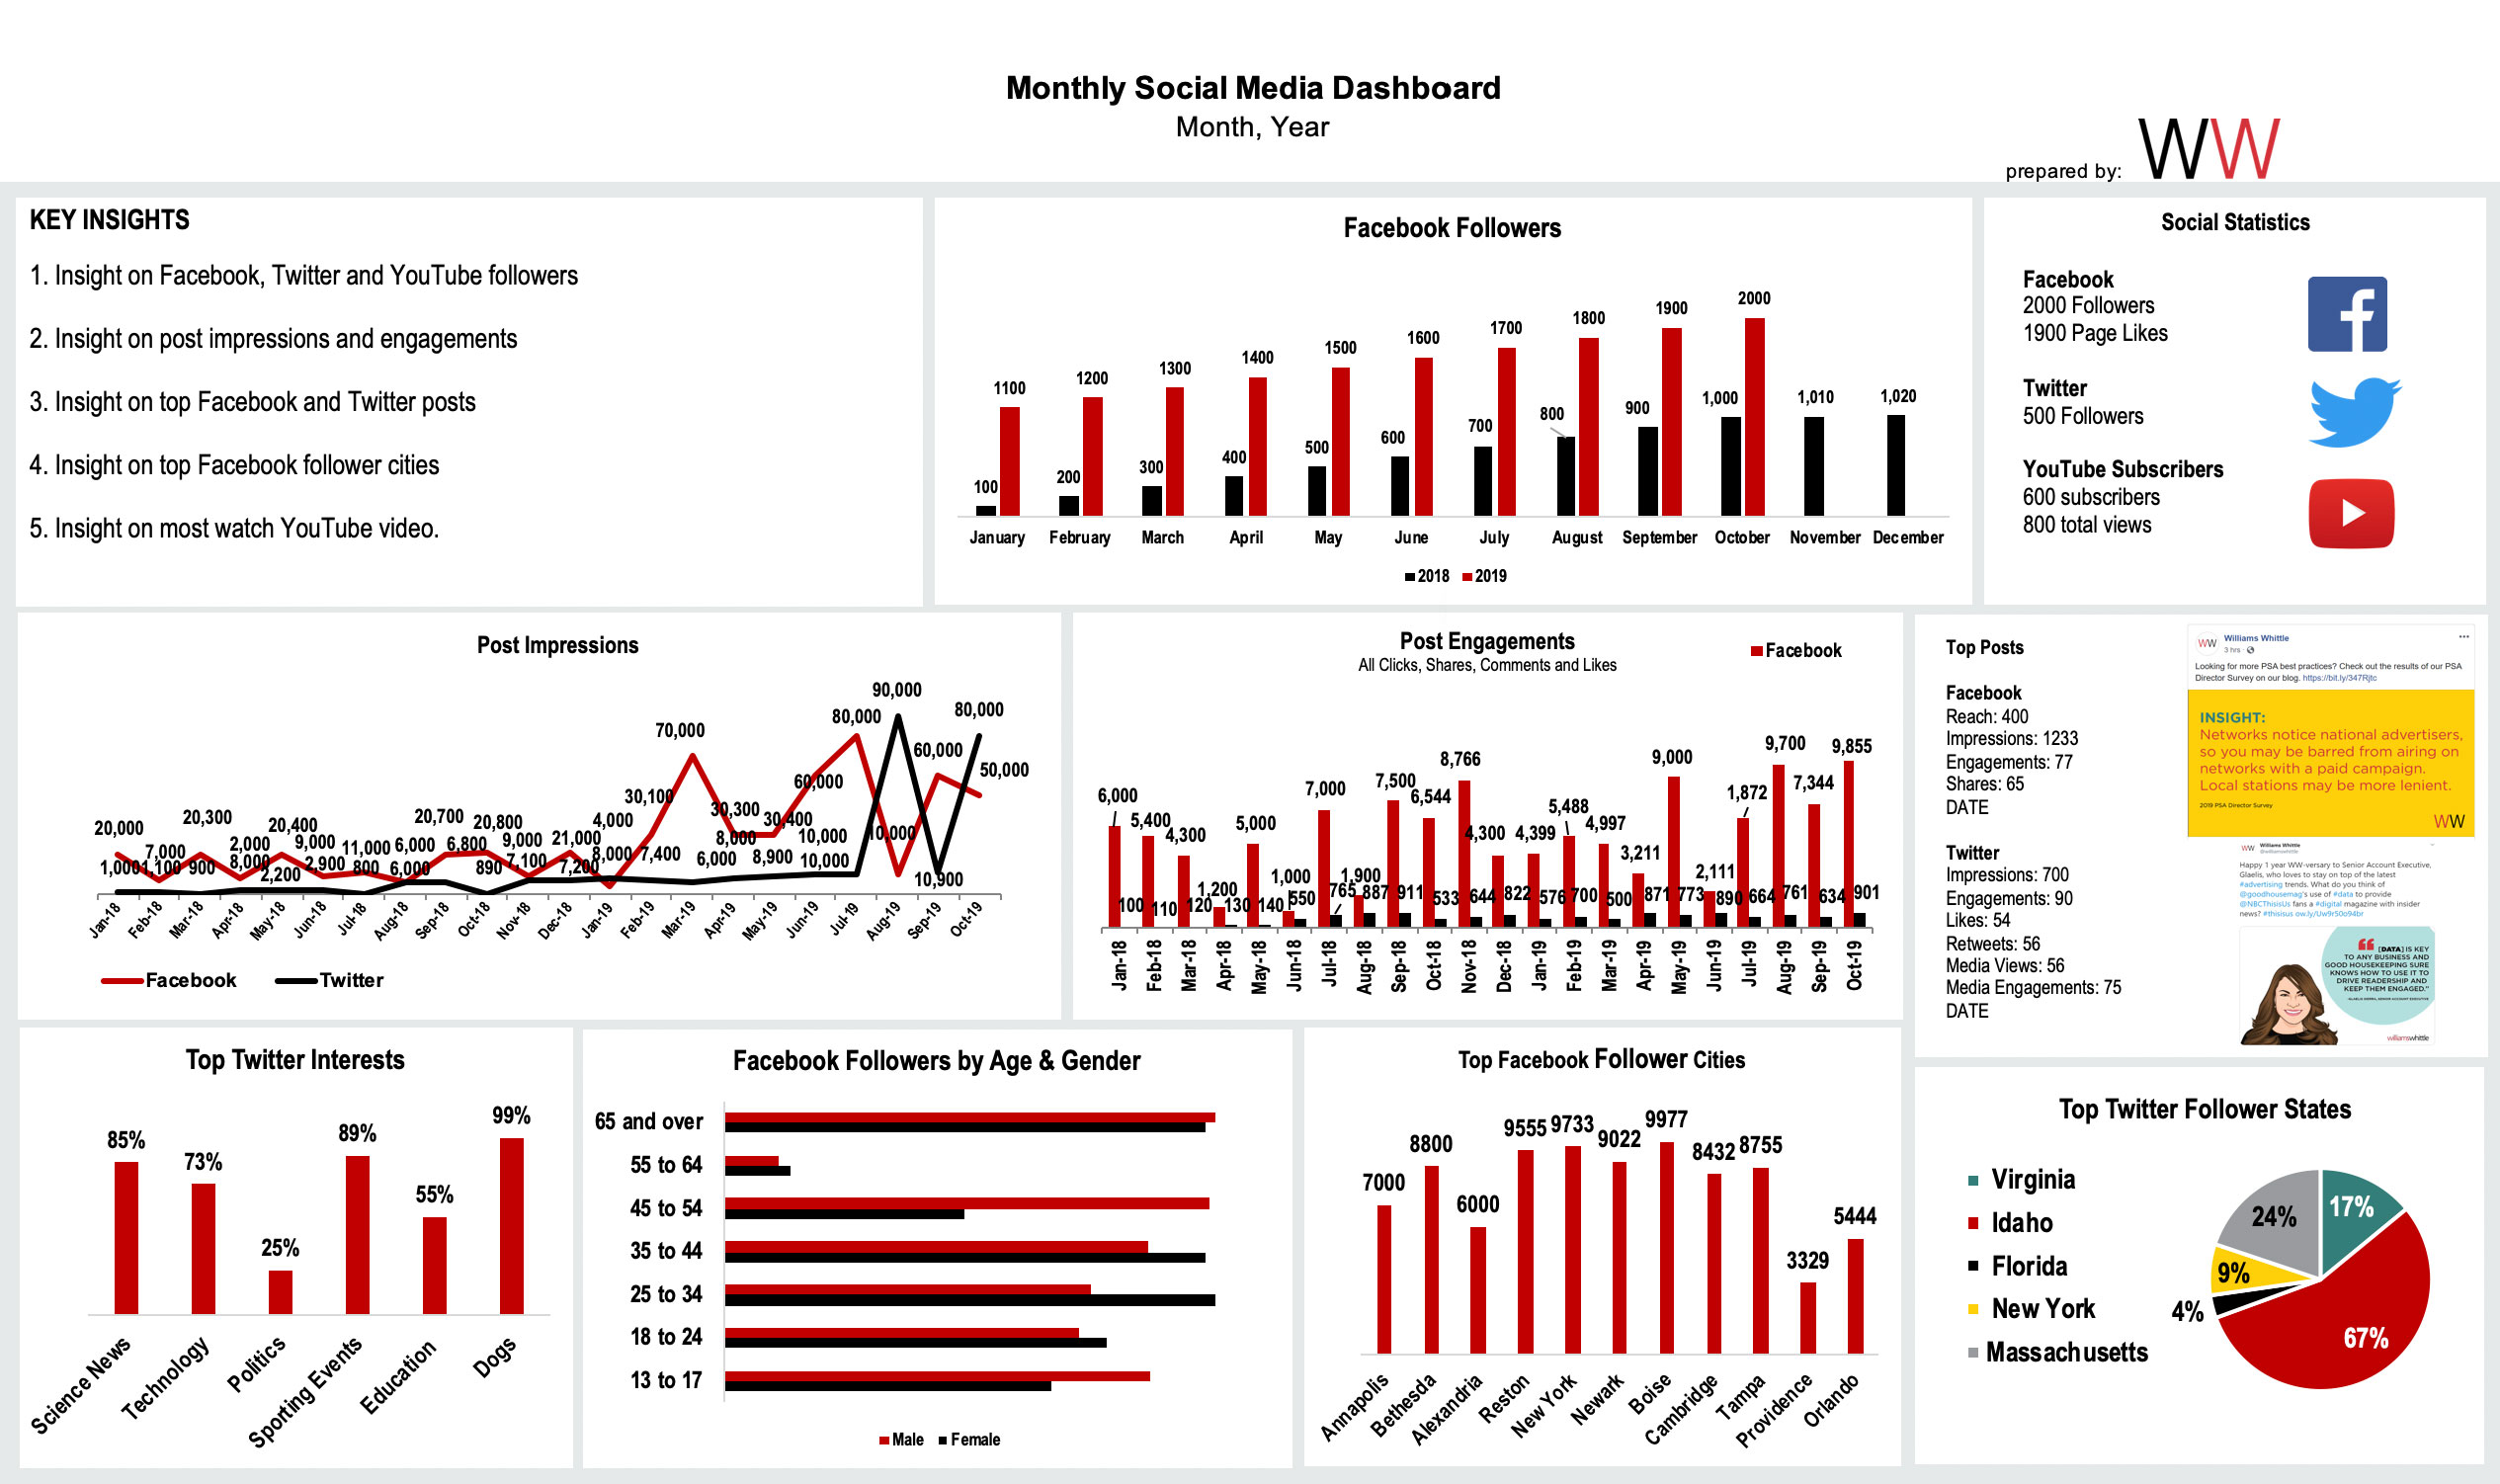
Each month we track insights in three categories:
- Audience Makeup
- Audience Engagement
- Content Audit
Social media is an important part of connecting with nonprofit donors, supporters, and volunteers, and a powerful tool for marketers.
Audience Makeup
Most nonprofits have Facebook, Twitter and YouTube channels at a minimum. With Facebook and Twitter, Followers are the users who choose to follow your page and receive updates on your content in their newsfeed. On YouTube, subscribers are the number of users that follow your account and get notifications to their account when you post new videos.
Our clients like to see steady increases in followers over time and they like to celebrate big milestones by thanking their followers by sharing creative posts like a fun animated gif.

Example of an animated gif used on social
Facebook provides insight into gender, age, and interest demographics that are interesting to track in order to ensure that you are reaching your target audience. This information may vary from the demographic information captured by Google Analytics from the subset of users logged into Google products. We find that nonprofit followers are frequently employees, volunteers, partners, and stakeholders versus website users which are more likely to be customers and donors. Knowing the makeup of each channel is extremely important so that you can customize your content accordingly to reach each of these targets.
In addition to gender, age, and interest demographics, you can track the geographic location of your followers. Facebook allows you to track this by city. Twitter has currently disabled audience insights which makes comparing demographic data to Facebook or other platforms a current challenge. Based on data tracked before this shift, we found that geographic location also varies from Facebook and Twitter Insights versus Google Analytics as your social followers may be different from your website visitors. By using geographic data, you might notice that your followers are mainly in one certain region, this would suggest making a shift to posting in the most relevant time zone even if it is not the same as your traditional time zone. One of our clients has a strong follower base in California and although they are headquartered on the East Coast, we post in Pacific Time in order to reach a higher volume of their followers.

Audience Engagement
There are many metrics that track social engagement. We track likes, views, impressions, reach, and post engagements.
Likes do not equal followers on Facebook. Someone can like your page but can unfollow it so they do not see any updates from you on their newsfeed. Twitter does not have an equivalent for likes but does allow users to mute pages if they do not want to receive updates on their timeline from a particular page.
YouTube Total Views are the number of times your videos have been viewed. This is cumulative of all the videos you have on your channel. This is interesting to watch month to month to see if there are more popular time frames that users access your content or how the addition of new videos to your channel increases your views. We also track how long viewers watch our videos. This provides valuable insight so that we can edit existing videos down to be viewed in their entirety.
Impressions measure the number of times your content is displayed, even if someone did not engage with it in any way.
Reach is the number of individual users who saw your content. It is different from impressions as a user could see your content more than once and make your impressions higher than your reach.
Engagements measure the number of likes, shares, retweets and comments that your posts received. This means that users interacted with your posts. It is important to consider the relationship between the impressions and engagements your posts receive. Likely, impressions will increase when engagements are higher. Impressions provide increased brand awareness and engagements create relationships and dialogue with your followers. Often, engagements are a good place to start tracking because like mentioned above, impressions will naturally increase with increased engagement so both metrics can be improved at the same time. But, how do you create engaging content? Consider making posts don’t just have flat messages to your audience, but those that ask them to provide their opinion in the form of comments or share the post to join a contest or become part of a movement. Check out our content audit section to see examples of some of our most engaging posts.

Content Audit
This is the most fun metric to track in our opinion because you get to learn about what content resonates with your audience. From our experience, video content typically performs the best followed by posts with images. And of course, any content with relevant hashtags will naturally gain more visibility.
While it is important to track post reach and impressions delivered, engagements are the ultimate goal of social media. So those posts that receive the most shares, likes, retweets and comments each month are those that we tend to replicate in future posts.

In addition to video and photography, we find that followers of our nonprofit social media channels love stories of real people with real photography and not stock images. Testimonials, quotes, animated gifs, recommendations, and infographics also tend to have high engagement.
The example you see above are two of our top posts on Facebook and Twitter. On Facebook, we generated increased interest in our annual PSA survey, by sharing brief insights from the longer form report that were visual, easy to read and linked back to the full report to learn more. On Twitter, we incorporated several engagement tactics in what could have generically been just a post sharing a relevant article. We created a graphic with a quote from our account director on her thoughts are an industry related article. This incorporated a visual post, hashtags, tagging of other accounts and a human element which all led to increased impressions and engagements. The more data you collect, the more you know about your target audiences to help guide you to create meaningful content in the future.
Stay tuned for more from our data series; next, we will be covering public service announcement dashboards and data visualization.