While the media landscape has changed significantly over the past 10 years—and new disruptors will continue to come and go— public service announcements (PSAs) are still the most cost-effective way to raise awareness of an issue to a mass audience.
Effective PSAs require high-quality creative, unique promotional strategies and unprecedented levels of donated media support.
We employ a third-party to track and evaluate PSA airings (or placements), estimated media value and impressions. It shows us exactly which station and market the PSA has aired, when it aired and during which programming. This data is important to track for ROI’s sake, but also to recalibrate our subsequent rounds of pitching of the campaign.
Our monthly PSA dashboards help our clients make sense of this data and helps us validate the strategy and modify as needed. Below is an overview of what we track and why.
Television Tracking Overview
Nielsen provides an electronic tracking service to automatically verify and capture airing details for TV and radio. Each spot must have an ISCI code to be tracked. When Nielsen detects an airing, data is recorded automatically. They are listed on the tracking reports according to geographic area (city/state/DMA), station, time of day (dayparts are early morning, daytime, early fringe, primetime, late evening, late night) and spot length (:10, :15, :30, :60, :90).
Nielsen audience delivery (impressions) is assigned to each spot and media value is assessed based on SQAD. SQAD provides CPM (cost per thousand) media values for each market and daypart, based on actual paid media buys that occurred during the previous month. When our distributor receives airing information from Nielsen, they match the daypart of the airing to the CPM value for that airing’s daypart. The media value for that airing is determined by multiplying the CPM value with the audience value for that airing provided by Nielsen (divided by 1,000).
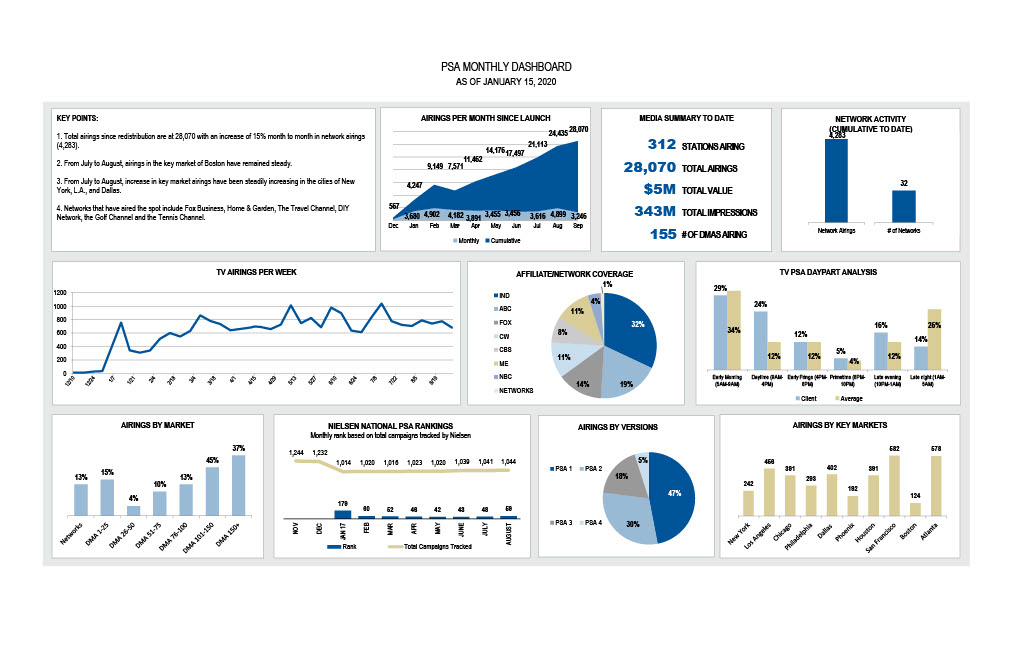
Media Summary to Date
The first thing that is summarized is the number of stations airing the PSA, the total number of airings, the total value of those airings, total impressions, and the total number of DMA’s airing the spot. If there are multiple spots in your campaign, you will want to include different summaries for each spot.
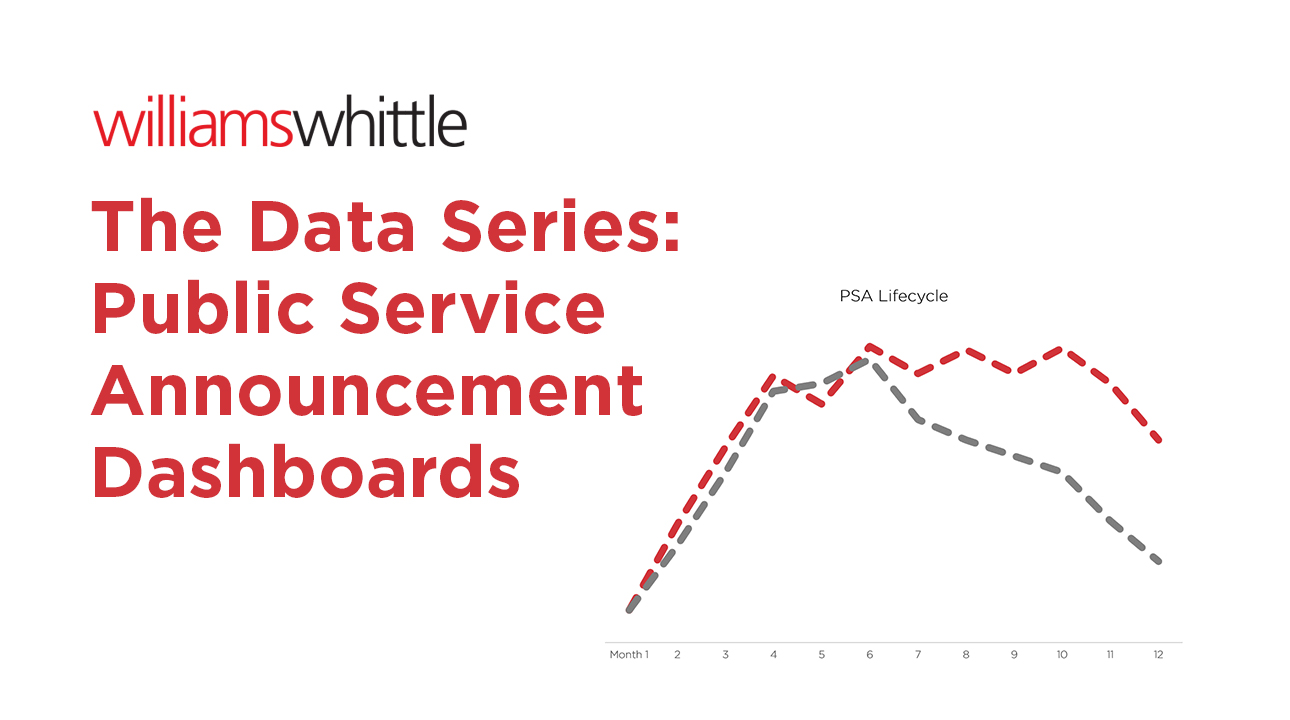
Airings Per Month & PSA Lifecycle
This is a data visualization of the spots airing each month during the campaign timeline. Data should be pulled for each version of creative to compare monthly airings. This helps to visualize the preferences of one spot over another by PSA Directors. Some clients like to see TV airings per day if they are focused on an end of year holiday campaign for example.
You should expect to see your PSA airings peak somewhere between 3-6 months. But the key metric is to see what happens after 6 months. You should see a peak, followed by additional peaks of airings and plateaus in between. Assuming there is continuous outreach to the media, only after 12 months should you see a decrease.

Network Airings & Affiliate Coverage
It is worth spending some time investigating exactly which networks you’re getting airtime on and when they are running. Network airings are nationwide airings amongst popular programming and therefore the most valuable PSA airtime you can get. Affiliate coverage is also important to see how your message is resonating among the major affiliates.
Market Penetration & Airings by Market
You want the majority of your airings in the top DMAs, 1-25 preferably, but top 50 is still good. Not only will you get the most eyeballs, but exposure to larger pools of donors. Airings by market are important to track to see if your media outreach has influenced airings. We keep a “likelihood to air” chart for each market based on historical airings for all of our clients. Traditionally, Washington D.C. is a very tough market for gaining PSA airtime and LA is one of the hottest markets for example.
Daypart Analysis
On average, about a quarter of PSAs run during the early hours of the morning (1 am to 5 am). But, to effectively reach people, you need daytime airings or waking hours. Or better yet, primetime airings (during 8-10pm).
Airings by Version
This is usually a pie chart that represents all of the various spot lengths and spot names. Usually the :30 spots get the highest airings, but we are starting to see increases for other spot lengths (:60s and :15s).
PSA Rankings
PSA rankings are the monthly rank your spot received based on airings of all campaigns tracked by Nielsen for that month. The number of PSAs in market varies but usually hovers between 1,000 – 1,500 PSAs. A strong showing would be the top 10% of all PSA campaigns nationally.
Other Media
OOH
Tracking OOH is very different from TV because the only source for valuation data is from the organizations that post the PSA messages. Accordingly, for OOH, we rely on the companies to provide usage and value data. These reports typically include the city and state where posting occurred (or the name of the airport/mall) the title of the creative, size, length of time the posting occurred, and the estimated value and audience.
Radio
Like OOH, radio is different from TV. The spots can be tracked, but since the spots cannot be encoded the data is dependent on self-reporting from the stations. Based on the reporting, you can track data such as when and where the spot aired, during which program, and the media value.
By using clip-tracking, you can glean data from your print PSAs that can help you in the future. Clip tracking can provide you with data such as when & where your PSA was placed, the publication’s circulation and its media value.
There may be other elements to include in your dashboard including traffic to the PSA landing page, phone calls to the 800 number, usage of the campaign hashtag, or downloads of any content related to the campaign.
At Williams Whittle we love data, stay tuned for more from our data series. Next we will be covering data visualization.